Cozmic’s Milky Way clones are cracking the universe’s dark code

A USC-led research team has created a series of supercomputer-simulated twins of our Milky Way galaxy — which could help scientists unlock new answers about one of the biggest mysteries in the universe: dark matter, the invisible substance that makes up about 85% of all matter in existence.

The research was led by cosmologist Vera Gluscevic, who is an associate professor at the USC Dornsife College of Letters, Arts, and Sciences; as well as Ethan Nadler, formerly a postdoc at USC and Carnegie Observatories who is now an assistant professor at University of California, San Diego; and Andrew Benson, a staff scientist at Carnegie Observatories.

They called their simulation project “COZMIC” — short for “Cosmological Zoom-in Simulations with Initial Conditions beyond Cold Dark Matter.”

Scientists have known for decades that dark matter exists — but until now, they could not study how galaxies are born and evolve in a universe where dark and normal matter interact. COZMIC has made that possible, the team said.

The development of COZMIC and the team’s results are described in a trio of studies published on June 16 in The Astrophysical Journal, a publication of the American Astronomical Society.

The heart of dark matter

Scientists know that dark matter is real because it affects how galaxies move and stick together. For example, galaxies spin so fast that they should fly apart, but they don’t. Something invisible holds them together; many scientists believe that dark matter is at the heart of this — an idea first suggested in 1933 by a Swiss researcher, Fritz Zwicky. Research on dark matter has evolved ever since.

Dark matter is tricky to study because it doesn’t emit any light or energy that can be easily detected. Scientists study dark matter by watching how it affects motions and structures like galaxies. However, that is somewhat like studying someone’s shadow without being able to examine in detail the actual person who cast the shadow.

For the suite of studies, the research team took the step of deploying new physics — not just standard particle physics and relativity — and programmed a supercomputer to create very detailed cosmological simulations through COZMIC to test different ideas about what dark matter might be doing.

“We want to measure the masses and other quantum properties of these particles, and we want to measure how they interact with everything else,” Gluscevic said. “With COZMIC, for the first time, we’re able to simulate galaxies like our own under radically different physical laws — and test those laws against real astronomical observations.”

In addition to Glusevic, Nadler and Benson, the team behind COZMIC includes Hai-Bo Yu of UC Riverside; Daneng Yang, formerly of UC Riverside and now at Purple Mountain Observatory CAS; Xiaolong Du of UCLA; and Rui An, formerly of USC.

Several dark matter scenarios

“Our simulations reveal that observations of the smallest galaxies can be used to distinguish dark matter models,” said Nadler.

For the studies with COZMIC, the scientists accounted for the following dark matter behavior scenarios:

  • Billiard-ball model: In this first study, every dark matter particle collides with protons early in the universe, much like billiard balls when they are first set in motion. This interaction smooths out small-scale structures and eliminates satellite galaxies in the Milky Way. The study also includes scenarios where dark matter moves at high speeds, and others in which it is composed of extremely low-mass particles.
  • Mixed-sector model: This second study is a hybrid scenario in which some dark matter particles interact with normal matter, but others pass through it.
  • Self-interacting model: For this third study, the scientists simulated a scenario in which dark matter interacts with itself both at the dawn of time and today, modifying galaxy formation across cosmic history.

While running these simulations, the scientists input new physics into the supercomputer to produce a galaxy whose structure bears the signatures of those interactions between normal and dark matter, said Benson.

Gluscevic added: “While many previous simulation suites have explored the effects of dark matter mass or self-interactions, until now, none have simulated dark matter interactions with normal matter. Such interactions are not exotic or implausible. They are, in fact, likely to exist.”

A new day for dark matter

The team says it is a big step forward in figuring out what dark matter really is. They hope that by comparing their twin galaxies to real telescope images, they can get even closer to solving one of space’s biggest mysteries.

“We’re finally able to ask, ‘Which version of the universe looks most like ours?'” Gluscevic said.

The COZMIC team plans to expand their work by directly testing the predictions from their simulations with telescope data so they may discover signatures of dark matter behavior in real galaxies.

This next stage could bring scientists closer than ever to understanding what dark matter is, and how it shapes the cosmos.

Share Button

Rainbow reefs revealed: The secret 112-million-year saga of glowing fish

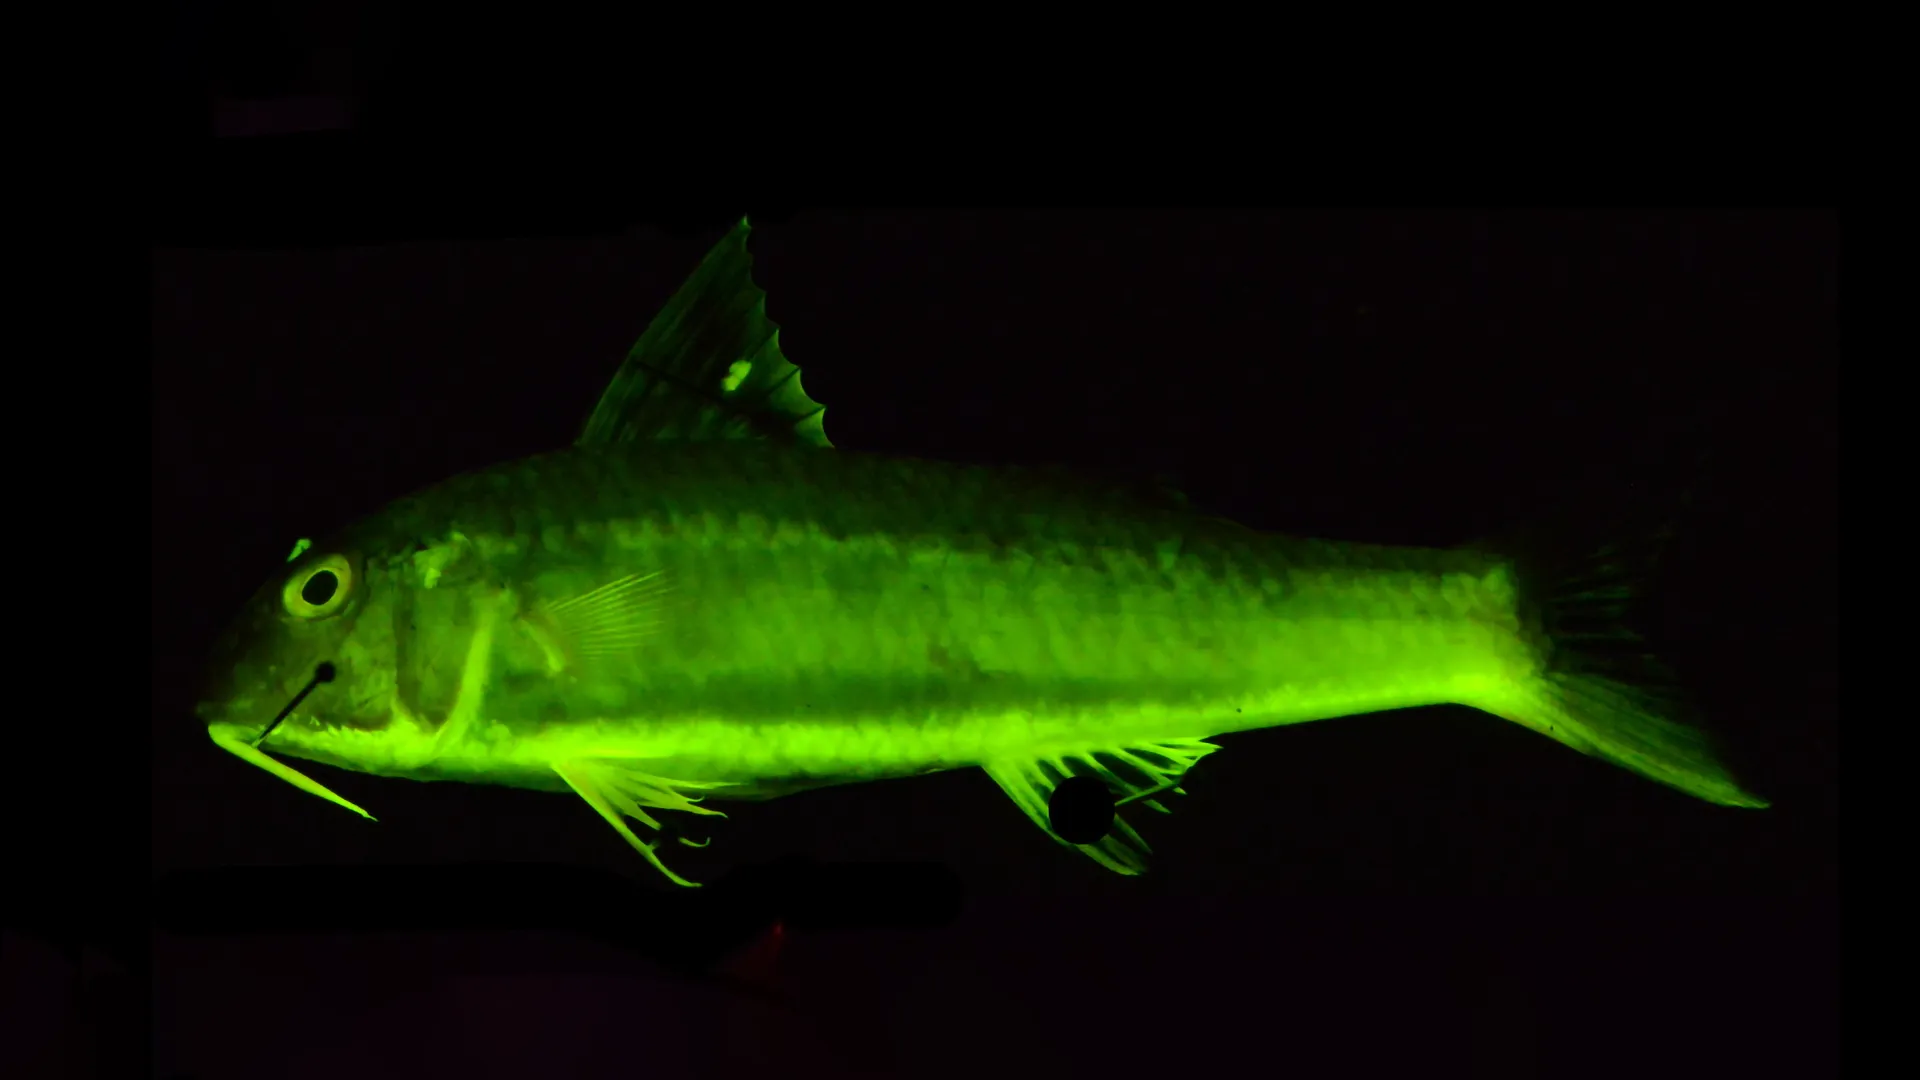
New research led by scientists at the American Museum of Natural History sheds light on the ancient origins of biofluorescence in fishes and the range of brilliant colors involved in this biological phenomenon. Detailed in two complementary studies recently published in Nature Communications and PLOS One, the findings suggest that biofluorescence dates back at least 112 million years and, since then, has evolved independently more than 100 times, with the majority of that activity happening among fish that live on coral reefs.

The new work also reveals that in marine fishes, biofluorescence — which occurs when an organism absorbs light, transforms it, and emits it as a different color — involves a greater variety of colors than previously reported, spanning multiple wavelengths of green, yellow, orange, and red.

“Researchers have known for a while that biofluorescence is quite widespread in marine animals, from sea turtles to corals, and especially among fishes,” said Emily Carr, a Ph.D. student in the Museum’s Richard Gilder Graduate School and the lead author on the two new studies. “But to really get to the root of why and how these species use this unique adaptation — whether for camouflage, predation, or reproduction — we need to understand the underlying evolutionary story as well as the scope of biofluorescence as it currently exists.”

For the Nature Communications study, Carr led a comprehensive survey of all known biofluorescent teleosts — a type of bony fish that make up by far the largest group of vertebrates alive today. This resulted in a list of 459 biofluorescent species, including 48 species that were previously unknown to be biofluorescent. The researchers found that biofluorescence evolved more than 100 times in marine teleosts and is estimated to date back about 112 million years, with the first instance occurring in eels.

The team also found that fish species that live in or around coral reefs evolve biofluorescence at about 10 times the rate of non-reef species, with an increase in the number of fluorescent species following the Cretaceous-Paleogene (K-Pg) extinction about 66 million years ago, when all of the non-avian dinosaurs died off.

“This trend coincides with the rise of modern coral-dominated reefs and the rapid colonization of reefs by fishes, which occurred following a significant loss of coral diversity in the K-Pg extinction,” Carr said. “These correlations suggest that the emergence of modern coral reefs could have facilitated the diversification of fluorescence in reef-associated teleost fishes.”

Of the 459 known biofluorescent teleosts reported in this study, the majority are associated with coral reefs.

For the PLOS One study, Carr and colleagues used a specialized photography setup with ultraviolet and blue excitation lights and emission filters to look at the wavelengths of light emitted by fishes in the Museum’s Ichthyology collection. Collected over the last decade and a half on Museum expeditions to the Solomon Islands, Greenland, and Thailand, the specimens in the study were previously observed fluorescing, but the full range of their biofluorescent emissions was unknown.

The new work reveals far more diversity in colors emitted by teleosts — some families of which exhibit at least six distinct fluorescent emission peaks, which correspond with wavelengths across multiple colors — than had previously been reported.

“The remarkable variation we observed across a wide array of these fluorescent fishes could mean that these animals use incredibly diverse and elaborate signaling systems based on species-specific fluorescent emission patterns,” said Museum Curator John Sparks, an author on the new studies and Carr’s advisor. “As these studies show, biofluorescence is both pervasive and incredibly phenotypically variable among marine fishes. What we would really like to understand better is how fluorescence functions in these highly variable marine lineages, as well as its role in diversification.”

The researchers also note that the numerous wavelengths of fluorescent emissions found in this study could have implications for identifying novel fluorescent molecules, which are routinely used in biomedical applications, including fluorescence-guided disease diagnosis and therapy.

Other authors involved in this work include Rene Martin, from the Museum and the University of Nebraska-Lincoln; Mason Thurman, from Clemson University; Karly Cohen, from California State University; Jonathan Huie, from George Washington University; David Gruber, from Baruch College and The Graduate Center, City University of New York; and Tate Sparks, Rutgers University.

Research in the Solomon Islands was supported by the National Science Foundation under Grant Number DEB-1257555.

The Museum greatly acknowledges the Dalio Foundation for its generous support of the inaugural Explore21 Expedition.

The Museum’s Exlopre21 initiative is generously supported by the leadership contributions of Katheryn P. and Thomas L. Kempner, Jr.

The 2019 Constantine S. Niarchos Expedition to Greenland was generously supported by the Stavros Niarchos Foundation.

Research in Thailand was funded by the Museum and the National Science Foundation Graduate Research Fellowship Program under Grant Number DEB-1938103.

Additional funding for this work was provided by the National Science Foundation under Grant Number DGE-1746914.

Share Button

Clever worms form superorganism towers to hitch rides on insects

Nematodes are the most abundant animal on earth, but when times get tough, these tiny worms have a hard time moving up and out. So, they play to the strength of their clade. If food runs out and competition turns fierce, they slither towards their numerous kin. They climb onto each other and over one another until their bodies forge a living tower that twists skyward where they might hitch a ride on a passing animal to greener and roomier pastures.

At least that’s what scientists assumed. For decades, these worm structures were more mythical than material. Such aggregations, in which animals link bodies for group movement, are rare in nature. Only slime molds, fire ants, and spider mites are known to move in this way. For nematodes, nobody had even seen the aggregations — known as towers — forming anywhere but within the artificial confines of laboratories and growth chambers; and nobody really knew what they were for. Did towers even exist in the real world?

Now, researchers in Konstanz, Germany, have recorded video footage of worms towering in fallen apples and pears from local orchards. The team from the Max Planck Institute of Animal Behavior (MPI-AB) and the University of Konstanz combined fieldwork with laboratory experiments to provide the first direct evidence that towering behavior occurs naturally and functions as a means of collective transport.

Natural towers

“I was ecstatic when I saw these natural towers for the first time,” says senior author Serena Ding, group leader at the MPI-AB, of the moment when co-author Ryan Greenway sent her a video recording from the field. “For so long natural worm towers existed only in our imaginations. But with the right equipment and lots of curiosity, we found them hiding in plain sight.”

Greenway, a technical assistant at the MPI-AB, spent months with a digital microscope combing through decaying fruit in orchards near the university to record natural occurrences and behavior of worm towers. Some of these whole towers were brought into the lab. What was inside the towers surprised the team. Although the fruits were crawling with many species of nematodes, natural towers were made only of a single species, all at the tough larval stage known as a “dauer.”

“A nematode tower is not just a pile of worms,” says the first author Daniela Perez, a postdoctoral researcher at MPI-AB. “It’s a coordinated structure, a superorganism in motion.”

Function of towers

The team observed the natural dauer towers waving in unison, much like individual nematodes do by standing on their tails to latch onto a passing animal. But their new findings showed that entire worm towers could respond to touch, detach from surfaces, and collectively attach to insects such as fruit flies — hitchhiking on mass to new environments.

To probe deeper, Perez built a controlled tower using laboratory cultures of C. elegans. When placed on food-free agar with a small vertical post — a toothbrush bristle — hungry worms began to self-assemble. Within two hours, living towers emerged, stable for over 12 hours, and capable of extending exploratory “arms” into surrounding space. Some even formed bridges across gaps to reach new surfaces.

“The towers are actively sensing and growing,” says Perez. “When we touched them, they responded immediately, growing toward the stimulus and attaching to it.”

This behavior, it turns out, is not restricted to the so-called “dauer” larval stage seen from the wild samples. Adult C. elegans and all larval stages in the lab also towered — an unexpected twist that suggests towering may be a more generalized strategy for group movement than previously assumed.

Yet despite the architectural complexity of these towers, the worms inside showed no obvious role differentiation. Individuals from the base and the apex were equally mobile, fertile, and strong, hinting at a form of egalitarian cooperation. But so far only, the authors point out, in the controlled conditions of the laboratory. “C. elegans is a clonal culture and so it makes sense that there is no differentiation within the tower. In natural towers, we might see separate genetic compositions and roles, which prompts fascinating questions about who cooperates and who cheats.”

As researchers seek to understand how group behavior evolves — from insect swarms to bird migrations — these microscopic worm towers might rise to provide some of the answers.

“Our study opens up a whole new system for exploring how and why animals move together,” says Ding who leads a research program on nematode behavior and genetics. “By harnessing the genetic tools available for C. elegans, we now have a powerful model to study the ecology and evolution of collective dispersal.”

Share Button

Black coffee, longer life: The science behind your morning perk

While you’re probably not pouring your morning cup for the long-term health benefits, coffee consumption has been linked to lower risk of mortality. In a new observational study, researchers from the Gerald J. and Dorothy R. Friedman School of Nutrition Science and Policy at Tufts University found the association between coffee consumption and mortality risk changes with the amount of sweeteners and saturated fat added to the beverage.

The study, published online in The Journal of Nutrition, found that consumption of 1-2 cups of caffeinated coffee per day was linked to a lower risk of death from all causes and death from cardiovascular disease. Black coffee and coffee with low levels of added sugar and saturated fat were associated with a 14% lower risk of all-cause mortality as compared to no coffee consumption. The same link was not observed for coffee with high amounts of added sugar and saturated fat.

“Coffee is among the most-consumed beverages in the world, and with nearly half of American adults reporting drinking at least one cup per day, it’s important for us to know what it might mean for health,” said Fang Fang Zhang, senior author of the study and the Neely Family Professor at the Friedman School. “The health benefits of coffee might be attributable to its bioactive compounds, but our results suggest that the addition of sugar and saturated fat may reduce the mortality benefits.”

The study analyzed data from nine consecutive cycles of the National Health and Nutrition Examination Survey (NHANES) from 1999 to 2018, linked to National Death Index Mortality Data. The study included a nationally representative sample of 46,000 adults aged 20 years and older who completed valid first-day 24-hour dietary recalls. Coffee consumption was categorized by type (caffeinated or decaffeinated), sugar, and saturated fat content. Mortality outcomes included all-cause, cancer, and cardiovascular disease. Low added sugar (from granulated sugar, honey, and syrup) was defined as under 5% of the Daily Value, which is 2.5 grams per 8-ounce cup or approximately half a teaspoon of sugar. Low saturated fat (from milk, cream, and half-and-half) was defined as 5% of the Daily Value, or 1 gram per 8-ounce cup or the equivalent of 5 tablespoons of 2% milk, 1 tablespoon of light cream, or 1 tablespoon of half-and-half.

In the study, consumption of at least one cup per day was associated with a 16% lower risk of all-cause mortality. At 2-3 cups per day, the link rose to 17%. Consumption beyond three cups per day was not associated with additional reductions, and the link between coffee and a lower risk of death by cardiovascular disease weakened when coffee consumption was more than three cups per day. No significant associations were seen between coffee consumption and cancer mortality.

“Few studies have examined how coffee additives could impact the link between coffee consumption and mortality risk, and our study is among the first to quantify how much sweetener and saturated fat are being added,” said first author Bingjie Zhou, a recent Ph.D. graduate from the nutrition epidemiology and data science program at the Friedman School. “Our results align with the Dietary Guidelines for Americans which recommend limiting added sugar and saturated fat.”

Limitations of the study include the fact that self-reported recall data is subject to measurement error due to day-to-day variations in food intake. The lack of significant associations between decaffeinated coffee and all-cause mortality could be due to the low consumption among the population studied.

Additional authors are Yongyi Pan and Lu Wang, both of the Friedman School, and Mengyuan Ruan, a graduate of the Friedman School.

The study was supported by the National Institutes of Health’s National Institute on Minority Health and Health Disparities under award number R01MD011501. Complete information on methodology is available in the published paper. The content is the sole responsibility of the authors and does not necessarily represent the official views the National Institutes of Health.

Share Button

MPs to vote on decriminalising abortion – how the law could change

Two Labour MPs have tabled rival amendments to the Crime and Policing Bill on abortion.

Share Button

Rise in awareness of nicotine pouches among children, survey suggests

A survey carried out by YouGov indicates 4% of children aged 11-17 have also tried them.

Share Button

Warning over TikTok filming by hospital patients

The Society of Radiographers says more patients are filming for social media without permission.

Share Button

Robots that feel heat, pain, and pressure? This new “skin” makes it possible

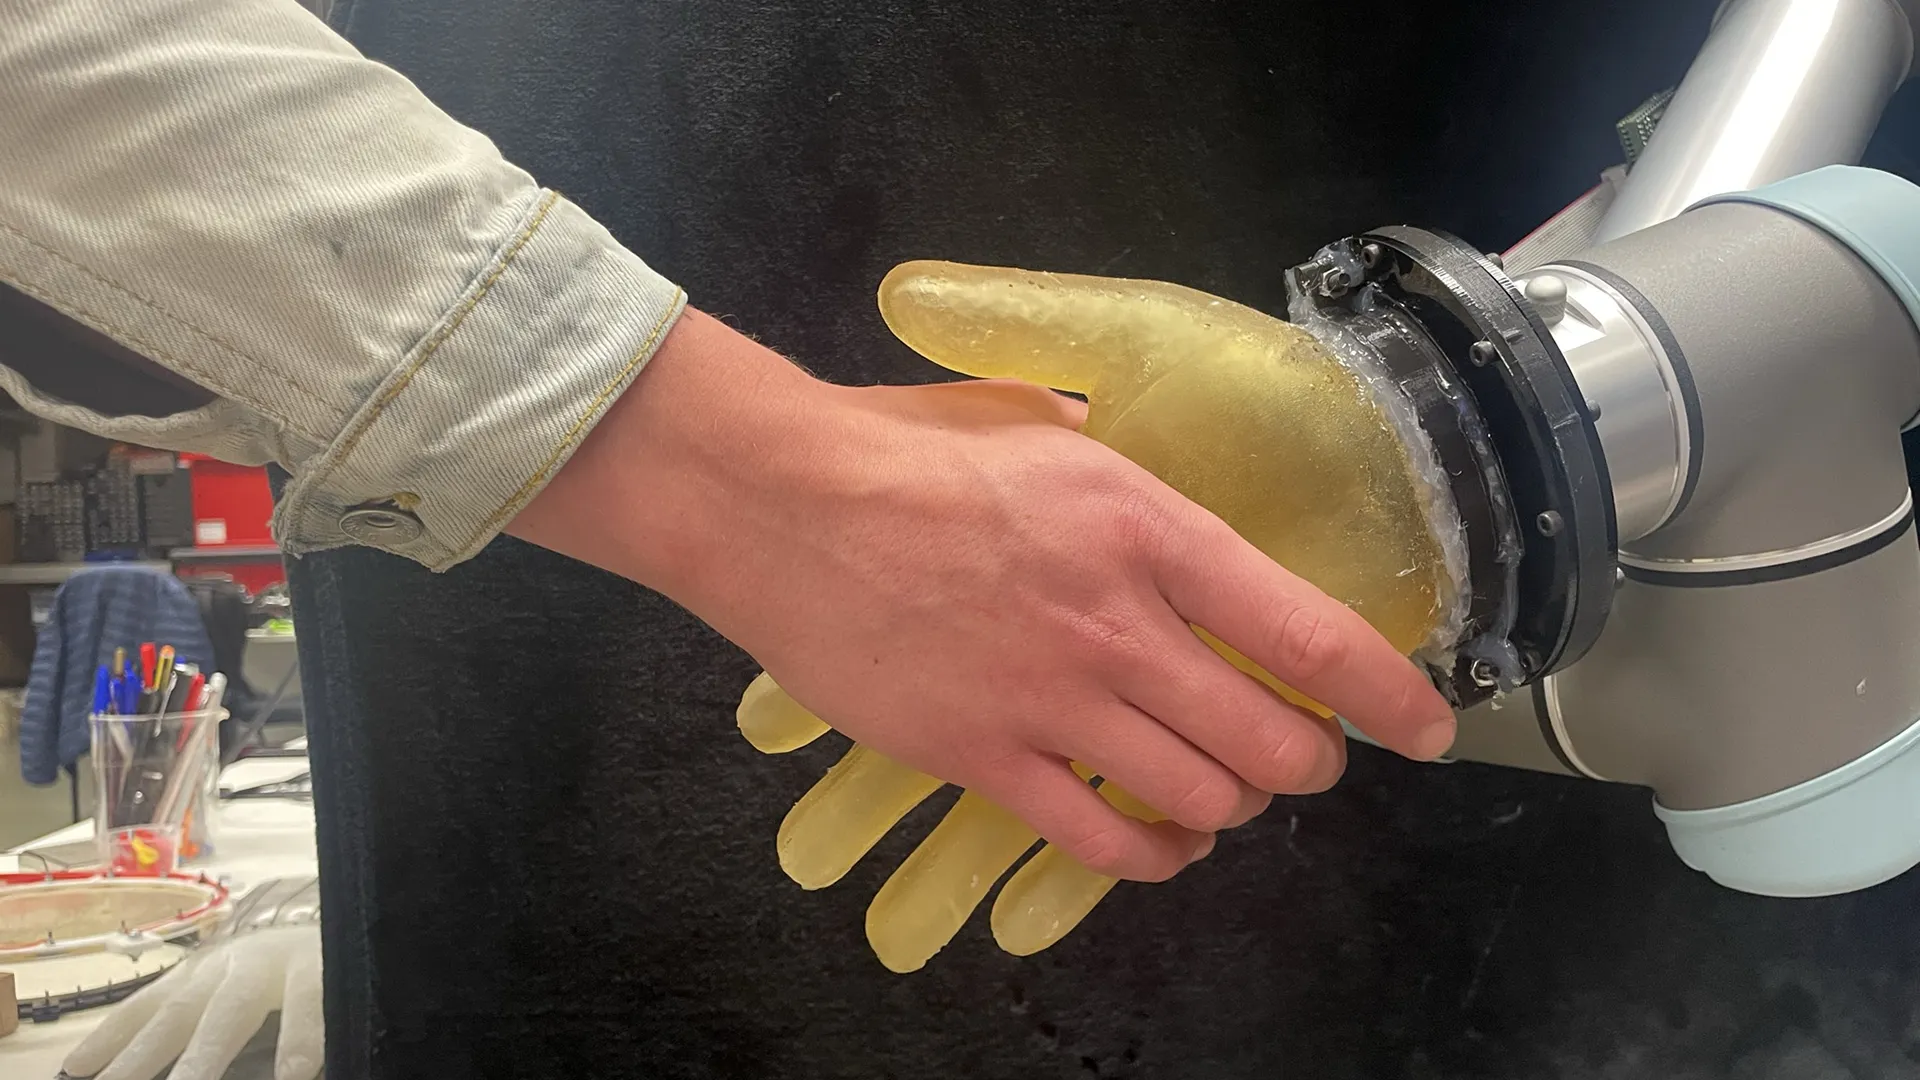
Scientists have developed a low-cost, durable, highly-sensitive robotic ‘skin’ that can be added to robotic hands like a glove, enabling robots to detect information about their surroundings in a way that’s similar to humans.

The researchers, from the University of Cambridge and University College London (UCL), developed the flexible, conductive skin, which is easy to fabricate and can be melted down and formed into a wide range of complex shapes. The technology senses and processes a range of physical inputs, allowing robots to interact with the physical world in a more meaningful way.

Unlike other solutions for robotic touch, which typically work via sensors embedded in small areas and require different sensors to detect different types of touch, the entirety of the electronic skin developed by the Cambridge and UCL researchers is a sensor, bringing it closer to our own sensor system: our skin.

Although the robotic skin is not as sensitive as human skin, it can detect signals from over 860,000 tiny pathways in the material, enabling it to recognise different types of touch and pressure – like the tap of a finger, a hot or cold surface, damage caused by cutting or stabbing, or multiple points being touched at once – in a single material.

The researchers used a combination of physical tests and machine learning techniques to help the robotic skin ‘learn’ which of these pathways matter most, so it can sense different types of contact more efficiently.

In addition to potential future applications for humanoid robots or human prosthetics where a sense of touch is vital, the researchers say the robotic skin could be useful in industries as varied as the automotive sector or disaster relief. The results are reported in the journal Science Robotics.

Electronic skins work by converting physical information – like pressure or temperature – into electronic signals. In most cases, different types of sensors are needed for different types of touch – one type of sensor to detect pressure, another for temperature, and so on – which are then embedded into soft, flexible materials. However, the signals from these different sensors can interfere with each other, and the materials are easily damaged.

“Having different sensors for different types of touch leads to materials that are complex to make,” said lead author Dr David Hardman from Cambridge’s Department of Engineering. “We wanted to develop a solution that can detect multiple types of touch at once, but in a single material.”

“At the same time, we need something that’s cheap and durable, so that it’s suitable for widespread use,” said co-author Dr Thomas George Thuruthel from UCL.

Their solution uses one type of sensor that reacts differently to different types of touch, known as multi-modal sensing. While it’s challenging to separate out the cause of each signal, multi-modal sensing materials are easier to make and more robust.

The researchers melted down a soft, stretchy and electrically conductive gelatine-based hydrogel, and cast it into the shape of a human hand. They tested a range of different electrode configurations to determine which gave them the most useful information about different types of touch. From just 32 electrodes placed at the wrist, they were able to collect over 1.7 million pieces of information over the whole hand, thanks to the tiny pathways in the conductive material.

The skin was then tested on different types of touch: the researchers blasted it with a heat gun, pressed it with their fingers and a robotic arm, gently touched it with their fingers, and even cut it open with a scalpel. The team then used the data gathered during these tests to train a machine learning model so the hand would recognize what the different types of touch meant.

“We’re able to squeeze a lot of information from these materials – they can take thousands of measurements very quickly,” said Hardman, who is a postdoctoral researcher in the lab of co-author Professor Fumiya Iida. “They’re measuring lots of different things at once, over a large surface area.”

“We’re not quite at the level where the robotic skin is as good as human skin, but we think it’s better than anything else out there at the moment,” said Thuruthel. “Our method is flexible and easier to build than traditional sensors, and we’re able to calibrate it using human touch for a range of tasks.”

In future, the researchers are hoping to improve the durability of the electronic skin, and to carry out further tests on real-world robotic tasks.

The research was supported by Samsung Global Research Outreach Program, the Royal Society, and the Engineering and Physical Sciences Research Council (EPSRC), part of UK Research and Innovation (UKRI). Fumiya Iida is a Fellow of Corpus Christi College, Cambridge.

Share Button

The invisible killer: PM 1 pollution uncovered across America

Air pollution causes health problems and is attributable to some 50,000 annual deaths in the United States, but not all air pollutants pack the same punch.

Scientists have tracked the scope of “PM 2.5” pollution over decades. PM 2.5 is a size of “particulate matter” that is less than 2.5 microns in diameter. But less information was available about its even tinier cousin, described as “submicron” or “PM 1” particulate matter, which is less than 1 micron in diameter. Why does that matter? Because the “little guys” might be the source of worse health effects.

With a study now published in The Lancet Planetary Health, researchers at Washington University in St. Louis have quantified the amount of PM 1 over the United States from the past 25 years.

“This measurement serves as a starting point to understand which pollutants regulators could target to make the most effective health impact,” said Randall Martin, the Raymond R. Tucker Distinguished Professor of energy, environmental and chemical engineering in the McKelvey School of Engineering. “This effort builds upon WashU’s strengths in satellite remote sensing and modeling atmospheric aerosols that were leveraged in this study,” he added.

Chi Li, research assistant professor in Martin’s atmospheric composition analysis group, is the first author of the work. Li said these estimates will enable further investigation into both the health and environmental effects of submicron particles.

Li said the very small particles quantified in this study generally come from direct air emissions, such as the black carbon particles released by diesel engines or the smoke from wildfires. Sometimes PM 1 can also form through secondary processes when sulfur dioxide or nitrogen oxides are spit out through fuel combustion and burning coal.

It makes intuitive sense that smaller particles of air pollution could do more damage to the human body because they are able to slip past the body’s innate defenses. These submicron particles are at least 6 times smaller than blood cells.

Air particles are not always one single thing, but mixtures of other materials stacked together.

The larger sizes of particles are critically more dominated by components that are not easily modifiable like mineral dust, noted Li.

The researchers were able to calculate their submicron estimates based on the known ratios of what makes up PM 2.5 particles, which include seven main components such as sulfate, nitrate and mineral dust.

“Putting the seven species together, we can calculate the total PM 1 concentration over the country,” Li said.

This research sets the stage for further analysis of where, how and why certain types of particles congregate, and how they can affect the environment and human body.

“When EPA first promulgated a fine PM air quality standard in 1997, there was considerable discussion about regulating PM 1 or PM2.5,” said Jay Turner, the James McKelvey Professor of Engineering Education and co-author on the study. “For numerous reasons, including but not limited to the lack of health impacts studies for PM 1 compared to studies for PM 2.5, the latter was chosen. This study provides a comprehensive, nationwide dataset to examine PM1 impacts on health.”

A next step will involve working with epidemiologists to assess the association of PM 1 with health outcomes.

The new dataset revealed another notable fact: pollution regulation does help. Across the contiguous U.S., average PM 1 levels in the air people breathe dropped sharply from 1998 to 2022, thanks to decades of environmental regulations like the Clean Air Act. However, this progress has slowed since 2010, mainly because of rising wildfire activity. Future pollution controls will need to address emerging, non-fossil fuel sources, study authors said.

Other countries like China have a head start tracking nationwide PM 1, but now the U.S. can quickly catch up.

“This dataset offers unprecedented information for the United States about an important pollutant for which few other measurements exist,” Martin said.

Funding from National Institute of Environmental Health Sciences, National Institutes of Health.

Share Button

Magnetic mayhem at the sun’s poles: First images reveal a fiery mystery

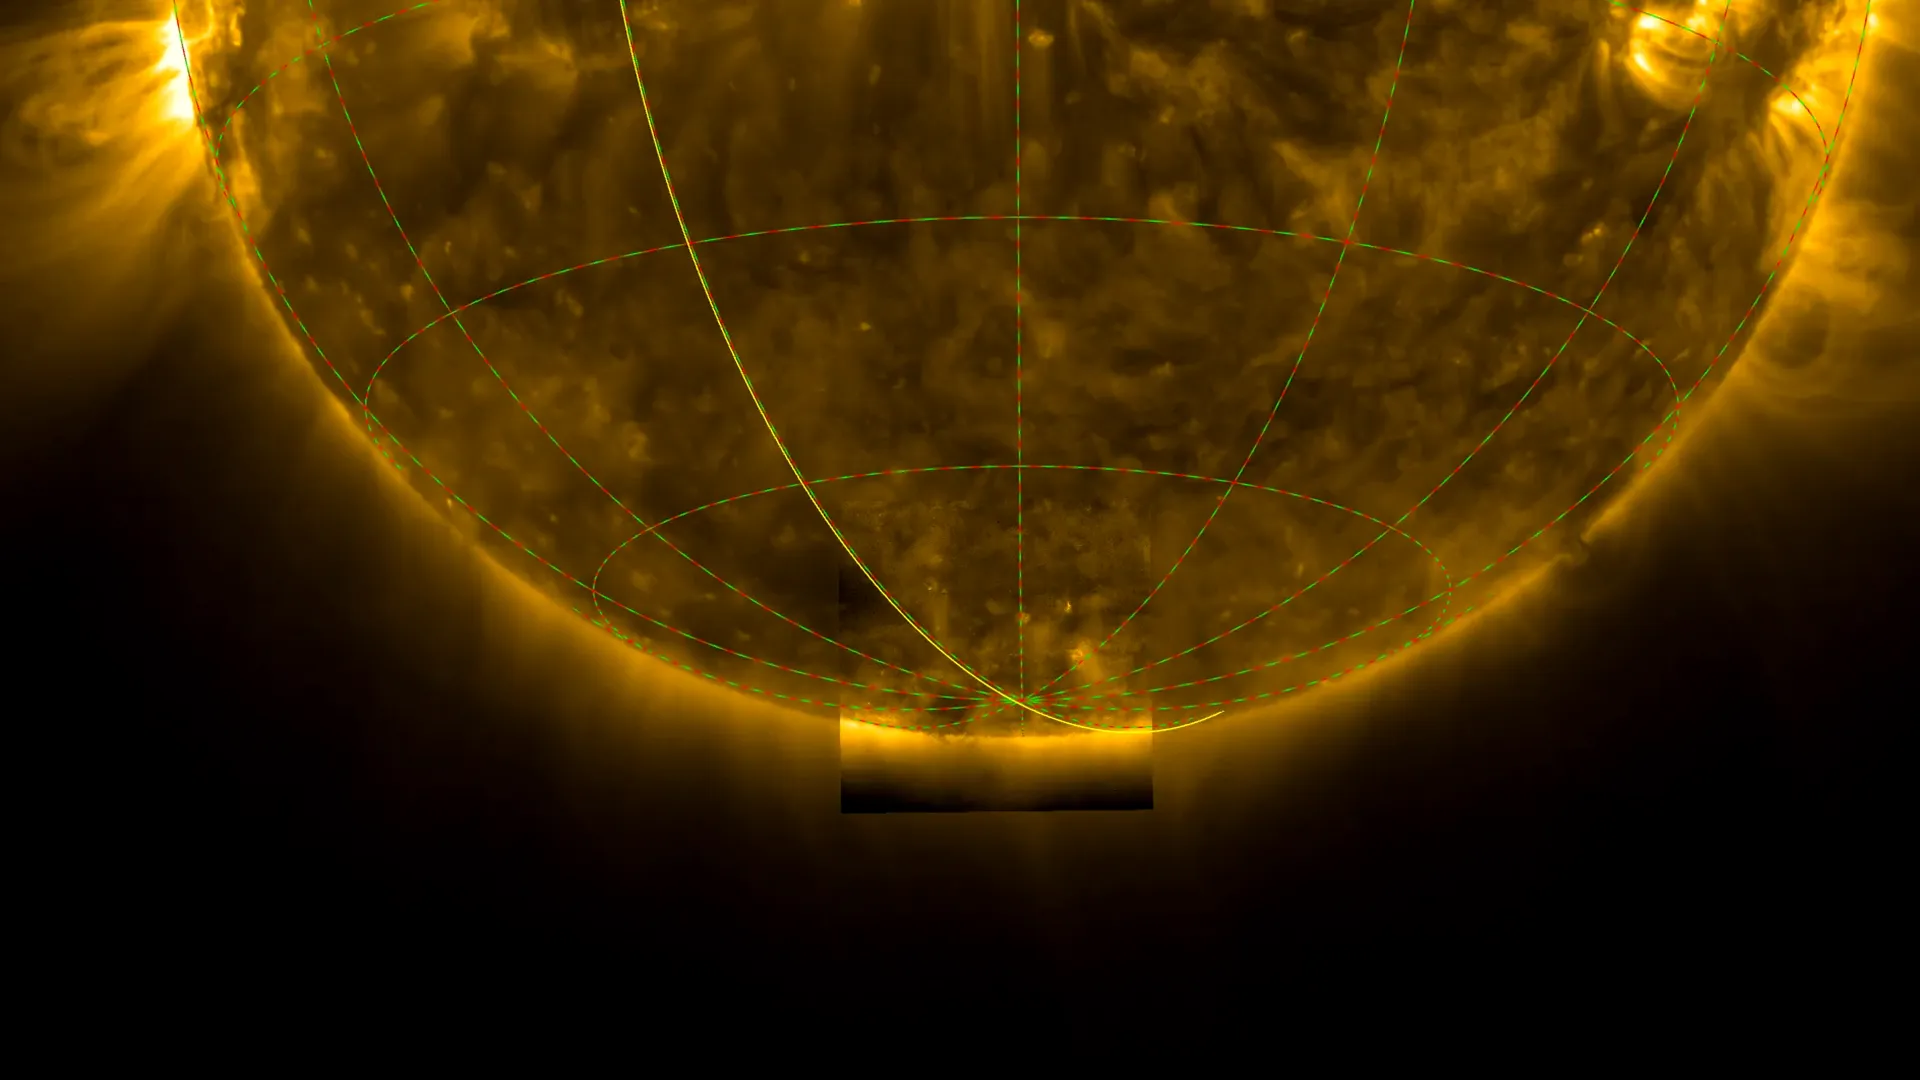
Thanks to its newly tilted orbit around the Sun, the European Space Agency-led Solar Orbiter spacecraft is the first to image the Sun’s poles from outside the ecliptic plane. Solar Orbiter’s unique viewing angle will change our understanding of the Sun’s magnetic field, the solar cycle and the workings of space weather.

Any image you have ever seen of the Sun was taken from around the Sun’s equator. This is because Earth, the other planets, and all other modern spacecraft orbit the Sun within a flat disc around the Sun called the ecliptic plane. By tilting its orbit out of this plane, Solar Orbiter reveals the Sun from a whole new angle.

The video titled ‘EUI video SolarOrbiter Sun south pole’ compares Solar Orbiter’s view (in yellow) with the one from Earth (grey), on 23 March 2025. At the time, Solar Orbiter was viewing the Sun from an angle of 17° below the solar equator, enough to directly see the Sun’s south pole. Over the coming years, the spacecraft will tilt its orbit even further, so the best views are yet to come.

“Today we reveal humankind’s first-ever views of the Sun’s pole” says Prof. Carole Mundell, ESA’s Director of Science. “The Sun is our nearest star, giver of life and potential disruptor of modern space and ground power systems, so it is imperative that we understand how it works and learn to predict its behaviour. These new unique views from our Solar Orbiter mission are the beginning of a new era of solar science.”

All eyes on the Sun’s south pole

A collage shows the Sun’s south pole as recorded on March 16-17, 2025, when Solar Orbiter was viewing the Sun from an angle of 15° below the solar equator. This was the mission’s first high-angle observation campaign, a few days before reaching its current maximum viewing angle of 17°.

The images shown in the collage were taken by three of Solar Orbiter’s scientific instruments: the Polarimetric and Helioseismic Imager (PHI), the Extreme Ultraviolet Imager (EUI), and the Spectral Imaging of the Coronal Environment (SPICE) instrument. Click on the image to zoom in and see video versions of the data.

“We didn’t know what exactly to expect from these first observations – the Sun’s poles are literally terra incognita,” says Prof. Sami Solanki, who leads the PHI instrument team from the Max Planck Institute for Solar System Research (MPS) in Germany.

The instruments each observe the Sun in a different way. PHI images the Sun in visible light (top left of the collage) and maps the Sun’s surface magnetic field (top centre). EUI images the Sun in ultraviolet light (top right), revealing the million-degree charged gas in the Sun’s outer atmosphere, the corona. The SPICE instrument (bottom row) captures light coming from different temperatures of charged gas above the Sun’s surface, thereby revealing different layers of the Sun’s atmosphere.

By comparing and analysing the complementary observations made by these three imaging instruments, we can learn about how material moves in the Sun’s outer layers. This may reveal unexpected patterns, such as polar vortices (swirling gas) similar to those seen around the poles of Venus and Saturn.

These groundbreaking new observations are also key to understanding the Sun’s magnetic field and why it flips roughly every 11 years, coinciding with a peak in solar activity. Current models and predictions of the 11-year solar cycle fall short of being able to predict exactly when and how powerfully the Sun will reach its most active state.

Messy magnetism at solar maximum

One of the first scientific findings from Solar Orbiter’s polar observations is the discovery that at the south pole, the Sun’s magnetic field is currently a mess. While a normal magnet has a clear north and south pole, the PHI instrument’s magnetic field measurements show that both north and south polarity magnetic fields are present at the Sun’s south pole.

This happens only for a short time during each solar cycle, at solar maximum, when the Sun’s magnetic field flips and is at its most active. After the field flip, a single polarity should slowly build up and take over the Sun’s poles. In 5-6 years from now, the Sun will reach its next solar minimum, during which its magnetic field is at its most orderly and the Sun displays its lowest levels of activity.

“How exactly this build-up occurs is still not fully understood, so Solar Orbiter has reached high latitudes at just the right time to follow the whole process from its unique and advantageous perspective,” notes Sami.

PHI’s view of the full Sun’s magnetic field puts these measurements in context (see ‘PHI_south-pole-Bmap’ and ‘PHI_global-Bmap_20250211-20250429’). The darker the colour (red/blue), the stronger the magnetic field is along the line of sight from Solar Orbiter to the Sun.

The strongest magnetic fields are found in two bands either side of the Sun’s equator. The dark red and dark blue regions highlight active regions, where magnetic field gets concentrated in sunspots on the Sun’s surface (photosphere).

Meanwhile, both the Sun’s south and north poles are speckled with red and blue patches. This demonstrates that at small scales, the Sun’s magnetic field has a complex and ever-changing structure.

SPICE measures movement for the first time

Another interesting ‘first’ for Solar Orbiter comes from the SPICE instrument. Being an imaging spectrograph, SPICE measures the light (spectral lines) sent out by specific chemical elements – among which hydrogen, carbon, oxygen, neon and magnesium – at known temperatures. For the last five years, SPICE has used this to reveal what happens in different layers above the Sun’s surface.

Now for the first time, the SPICE team has also managed to use precise tracking of spectral lines to measure how fast clumps of solar material are moving. This is known as a ‘Doppler measurement’, named after the same effect that makes passing ambulance sirens change pitch as they drive by.

The resulting velocity map reveals how solar material moves within a specific layer of the Sun. By comparing the SPICE doppler and intensity maps, you can directly compare the location and movement of particles (carbon ions) in a thin layer called the ‘transition region’, where the Sun’s temperature rapidly increases from 10 000 °C to hundreds of thousands of degrees.

The SPICE intensity map reveals the locations of clumps of carbon ions. The SPICE doppler map includes the blue and red colours to indicate how fast the carbon ions are moving towards and away from the Solar Orbiter spacecraft, respectively. Darker blue and red patches are related to material flowing faster due to small plumes or jets.

Crucially, Doppler measurements can reveal how particles are flung out from the Sun in the form of solar wind. Uncovering how the Sun produces solar wind is one of Solar Orbiter’s key scientific goals.

“Doppler measurements of solar wind setting off from the Sun by current and past space missions have been hampered by the grazing view of the solar poles. Measurements from high latitudes, now possible with Solar Orbiter, will be a revolution in solar physics,” says SPICE team leader, Frédéric Auchère from the University of Paris-Saclay (France).

The best is yet to come

These are just the first observations made by Solar Orbiter from its newly inclined orbit, and much of this first set of data still awaits further analysis. The complete dataset of Solar Orbiter’s first full ‘pole-to-pole’ flight past the Sun is expected to arrive on Earth by October 2025. All ten of Solar Orbiter’s scientific instruments will collect unprecedented data in the years to come.

“This is just the first step of Solar Orbiter’s ‘stairway to heaven’: in the coming years, the spacecraft will climb further out of the ecliptic plane for ever better views of the Sun’s polar regions. These data will transform our understanding of the Sun’s magnetic field, the solar wind, and solar activity,” notes Daniel Müller, ESA’s Solar Orbiter project scientist.

Notes for editors

Solar Orbiter is the most complex scientific laboratory ever to study our life-giving star, taking images of the Sun from closer than any spacecraft before and being the first to look at its polar regions.

In February 2025, Solar Orbiter officially began the ‘high latitude’ part of its journey around the Sun by tilting its orbit to an angle of 17° with respect to the Sun’s equator. In contrast, the planets and all other Sun-observing spacecraft orbit in the ecliptic plane, tilted at most 7° from the solar equator.

The only exception to this is the ESA/NASA Ulysses mission (1990-2009), which flew over the Sun’s poles but did not carry any imaging instruments. Solar Orbiter’s observations will complement Ulysses’ by observing the poles for the first time with telescopes, in addition to a full suite of in-situ sensors, while flying much closer to the Sun. Additionally, Solar Orbiter will monitor changes at the poles throughout the solar cycle.

Solar Orbiter will continue to orbit around the Sun at this tilt angle until 24 December 2026, when its next flight past Venus will tilt its orbit to 24°. From 10 June 2029, the spacecraft will orbit the Sun at an angle of 33°. (Overview of Solar Orbiter’s journey around the Sun.)

Solar Orbiter is a space mission of international collaboration between ESA and NASA, operated by ESA. Solar Orbiter’s Polarimetric and Helioseismic Imager (PHI) instrument is led by the Max Planck Institute for Solar System Research (MPS), Germany. The Extreme Ultraviolet Imager (EUI) instrument is led by the Royal Observatory of Belgium (ROB). The Spectral Imaging of the Coronal Environment (SPICE) instrument is a European-led facility instrument, led by the Institut d’Astrophysique Spatiale (IAS) in Paris, France.

Share Button