There will be restrictions on who can carry out procedures and fines for those who flout the law, in England in 2027.


There will be restrictions on who can carry out procedures and fines for those who flout the law, in England in 2027.
Perran Moon, MP for Camborne and Redruth, voluntarily referred himself for investigation.
The sixth report from Covid inquiry criticises the lack of PPE and the way patients were discharged from hospital.
Statins are among the most important medications for preventing cardiovascular disease. By lowering cholesterol, they have helped save millions of lives and reduce the likelihood of heart attacks and strokes. However, these benefits can come with unwanted effects. Some patients develop muscle pain or weakness, while a small number experience serious muscle breakdown that can potentially cause kidney failure.
Scientists at the University of British Columbia (UBC), working with colleagues at the University of Wisconsin-Madison, have identified a molecular mechanism that helps explain these complications. Their findings, published in Nature Communications, could guide the development of safer statins that maintain their cholesterol-lowering benefits while minimizing muscle damage.
How Statins Trigger a Harmful Calcium Leak
To investigate what happens inside muscle cells, the researchers used cryo-electron microscopy, an advanced imaging method that allows scientists to examine protein structures in remarkable detail. Their investigation centered on the ryanodine receptor (RyR1), a protein that regulates the movement of calcium within muscle cells.
Under normal conditions, this protein functions as a controlled gateway, releasing calcium when muscles need to contract. The researchers found that statins can interfere with this process by holding the channel open. As a result, calcium escapes continuously into areas where it should be carefully regulated, creating conditions that can injure muscle tissue.
“We were able to see, almost atom by atom, how statins latch onto this channel,” said lead author Dr. Steven Molinarolo, a postdoctoral researcher in UBC’s department of biochemistry and molecular biology. “That leak of calcium explains why some patients experience muscle pain or, in extreme cases, life-threatening complications.”
Three Statin Molecules Reveal the Mechanism Behind Muscle Damage
The researchers concentrated on atorvastatin, a commonly prescribed medication for lowering cholesterol. Although this particular drug was the main focus, their results suggest that similar interactions could occur with other medications in the statin family.
One of the most striking discoveries was the unusual way statin molecules attach to the calcium channel. Rather than acting individually, three molecules occupy a specific pocket within the protein. The first binds while the channel is closed, making it more likely to open. Two additional molecules then enter the pocket and hold the channel open, allowing calcium to continue leaking.
“This is the first time we’ve had a clear picture of how statins activate this channel,” said Dr. Filip Van Petegem, senior author and professor at UBC’s Life Sciences Institute. “It’s a big step forward because it gives us a roadmap for designing statins that don’t interact with muscle tissue.”
This detailed understanding could give drug developers a way to address the problem at its source. By modifying the specific features of statin molecules that interfere with muscle proteins, scientists may be able to reduce unwanted effects without compromising the drugs’ ability to control cholesterol.
A Potential Path Toward Safer Cholesterol Drugs
More than 200 million people worldwide use statins. Although severe muscle injury occurs in only a small percentage of patients, less serious problems such as soreness, weakness, and fatigue are considerably more widespread. These symptoms can be disruptive enough that some people discontinue their medication, potentially losing important protection against cardiovascular disease.
The discovery could eventually help researchers create treatments that are easier to tolerate, allowing more patients to continue taking medications that reduce their risk of heart attacks and strokes.
Achieving this level of understanding required exceptionally detailed imaging. Working with the high-resolution macromolecular cryo-electron microscopy facility at UBC’s faculty of medicine, the team was able to observe precisely how statin molecules interact with the muscle protein. These structural insights connect a longstanding drug safety concern to a specific molecular process, providing valuable information for future medication development.
“Statins have been a cornerstone of cardiovascular care for decades,” Dr. Van Petegem said. “Our goal is to make them even safer, so patients can benefit without fear of serious side effects.”
Although additional research and drug development will be needed before these findings translate into new treatments, they offer a promising direction. For millions of people who depend on statins to protect their hearts, future medications with fewer muscle-related complications could make treatment more comfortable and improve everyday quality of life.
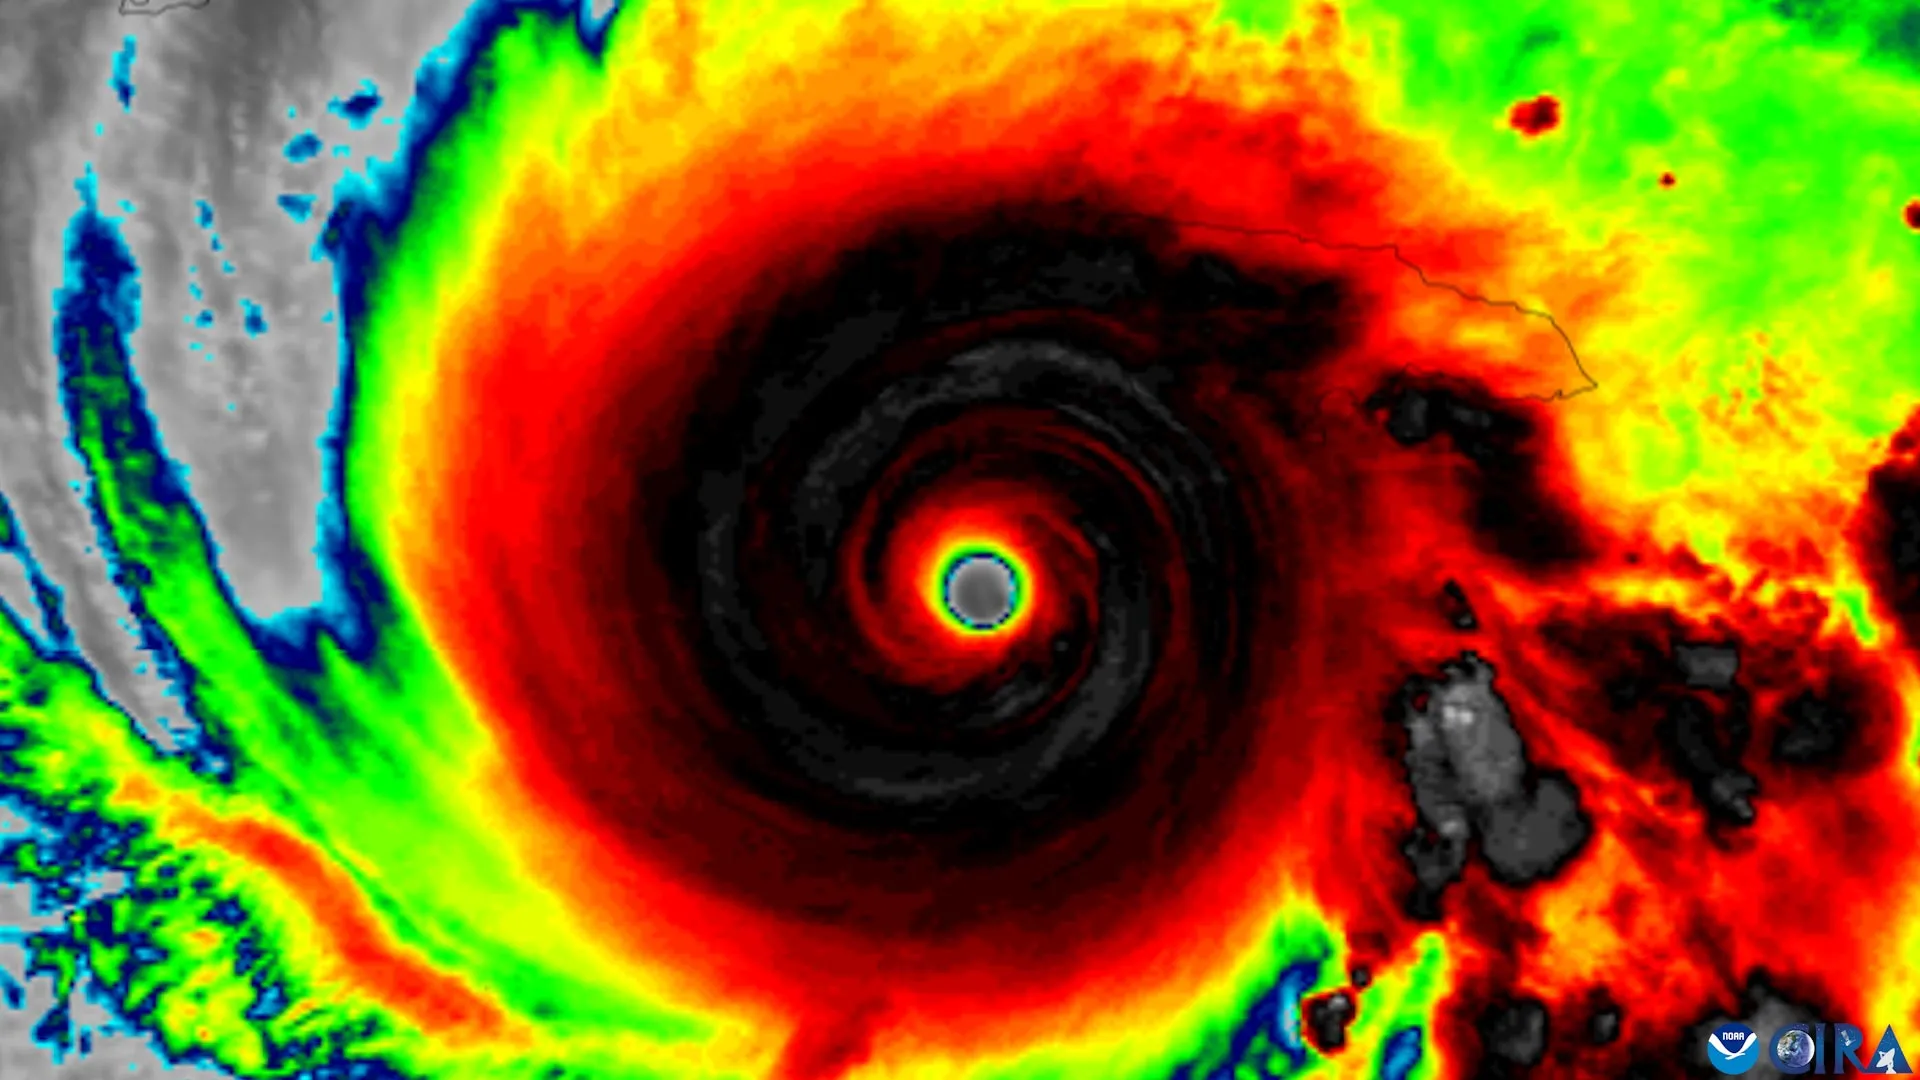
An updated hurricane forecast map is making it easier for people to identify areas threatened by storms, but new research reveals a concerning limitation. Even when people can recognize where hurricane watches are in effect, they may not feel more at risk or become more inclined to take precautions.
Researchers at Florida State University examined whether changes to the National Hurricane Center (NHC) forecast graphics improve public understanding of hurricane threats. The study involved faculty from the School of Communication within the College of Communication and Information and the Department of Geography.
The researchers evaluated an experimental graphic that expands the traditional hurricane forecast cone to include tropical storm and hurricane watches and warnings for inland areas. The familiar cone has historically placed greater emphasis on coastal regions, even though dangerous storm conditions can extend far from the shoreline.
The findings revealed mixed results. Although the revised graphic helped people without specialized weather knowledge recognize inland areas under hurricane or tropical storm watches, it did not significantly influence how dangerous they believed the storms would be or whether they intended to take protective measures. Participants also showed no improvement in identifying areas covered by storm warnings.
The updated format was developed by the NHC in 2024, and the findings were published in the American Meteorological Society journal Weather, Climate, and Society.
“The National Hurricane Center has made a number of thoughtful changes to improve how hurricane information is communicated,” said Assistant Professor Elizabeth Ray, the study’s lead author. “We had a simple question. Do those changes actually help people understand what the graphic is telling them about the risk they face?”
Why People Misunderstand Hurricane Forecast Maps
To investigate how the public interprets hurricane forecasts, the research team surveyed residents of Florida and Georgia. Participants were shown either the conventional hurricane cone graphic or the newer experimental version that includes additional information about inland storm threats.
People who saw the revised map were more successful at identifying locations under hurricane or tropical storm watches. However, that improvement in recognizing watch areas did not lead to greater concern about the potential danger or stronger intentions to take safety precautions.
The results also highlighted a persistent misunderstanding surrounding the familiar hurricane “cone of uncertainty.” Many people incorrectly interpret the width of the cone as an indication of a storm’s physical size, rather than understanding what the graphic is intended to communicate about the uncertainty in its projected track.
“For years, research has shown that people often mistake a wider cone for a bigger storm,” Ray said. “Our findings suggest that even with an updated graphic, that misconception can be hard to shake.”
Why Better Hurricane Warnings May Not Be Enough
The NHC introduced its expanded forecast graphic in 2024 to help people recognize that hurricane dangers are not limited to communities along the coast. Flooding, tornadoes, and destructive winds can threaten areas well inland, making it important for residents beyond coastal evacuation zones to understand their potential exposure.
By adding inland hurricane and tropical storm watches and warnings to the traditional forecast cone, the updated graphic provides a more complete picture of where dangerous conditions could develop.
However, the study suggests that adding useful information to a forecast does not automatically make people more aware of their personal risk or more likely to respond appropriately.
The researchers stressed that their findings do not call into question the quality of the NHC’s weather predictions, which they consider highly accurate. Instead, the results underscore the difficulty of presenting complex meteorological information in a way that people can readily interpret and use when making safety decisions.
“Our question wasn’t whether the science is good,” said co-author Patrick Merle, professor and director of the School of Communication. “The science is excellent. The question is how we communicate that science so people who aren’t meteorologists understand the risk they’re facing.
If people find information credible but still don’t understand it well enough to take protective action, then communication has fallen short. The goal is to empower people with information they can use to stay safe.”
How to Better Understand Hurricane Risks
The findings point to the importance of looking beyond a single forecast image when preparing for a hurricane. Although the cone can provide valuable information about a storm’s expected path, it cannot communicate every hazard that a particular community might experience.
The researchers recommend using hurricane forecast graphics alongside local weather predictions and detailed information about possible impacts. Understanding the specific threats to an area, as well as the protective steps residents should consider, can provide a more useful basis for making decisions.
“Our findings are a reminder that one graphic can only tell you part of the story,” Ray said. “Don’t rely on the cone alone. Pair it with clear, local information about what impacts to expect and what actions to take. That gives you a fuller picture of what the storm could mean where you live and what to do next.”
The study received funding through an internal Florida State University SEED grant. The research was also informed by discussions with the NHC, which supplied the experimental forecast graphics evaluated by the team.
Bradford Johnson, an assistant professor in the Department of Geography, contributed as a co-author.
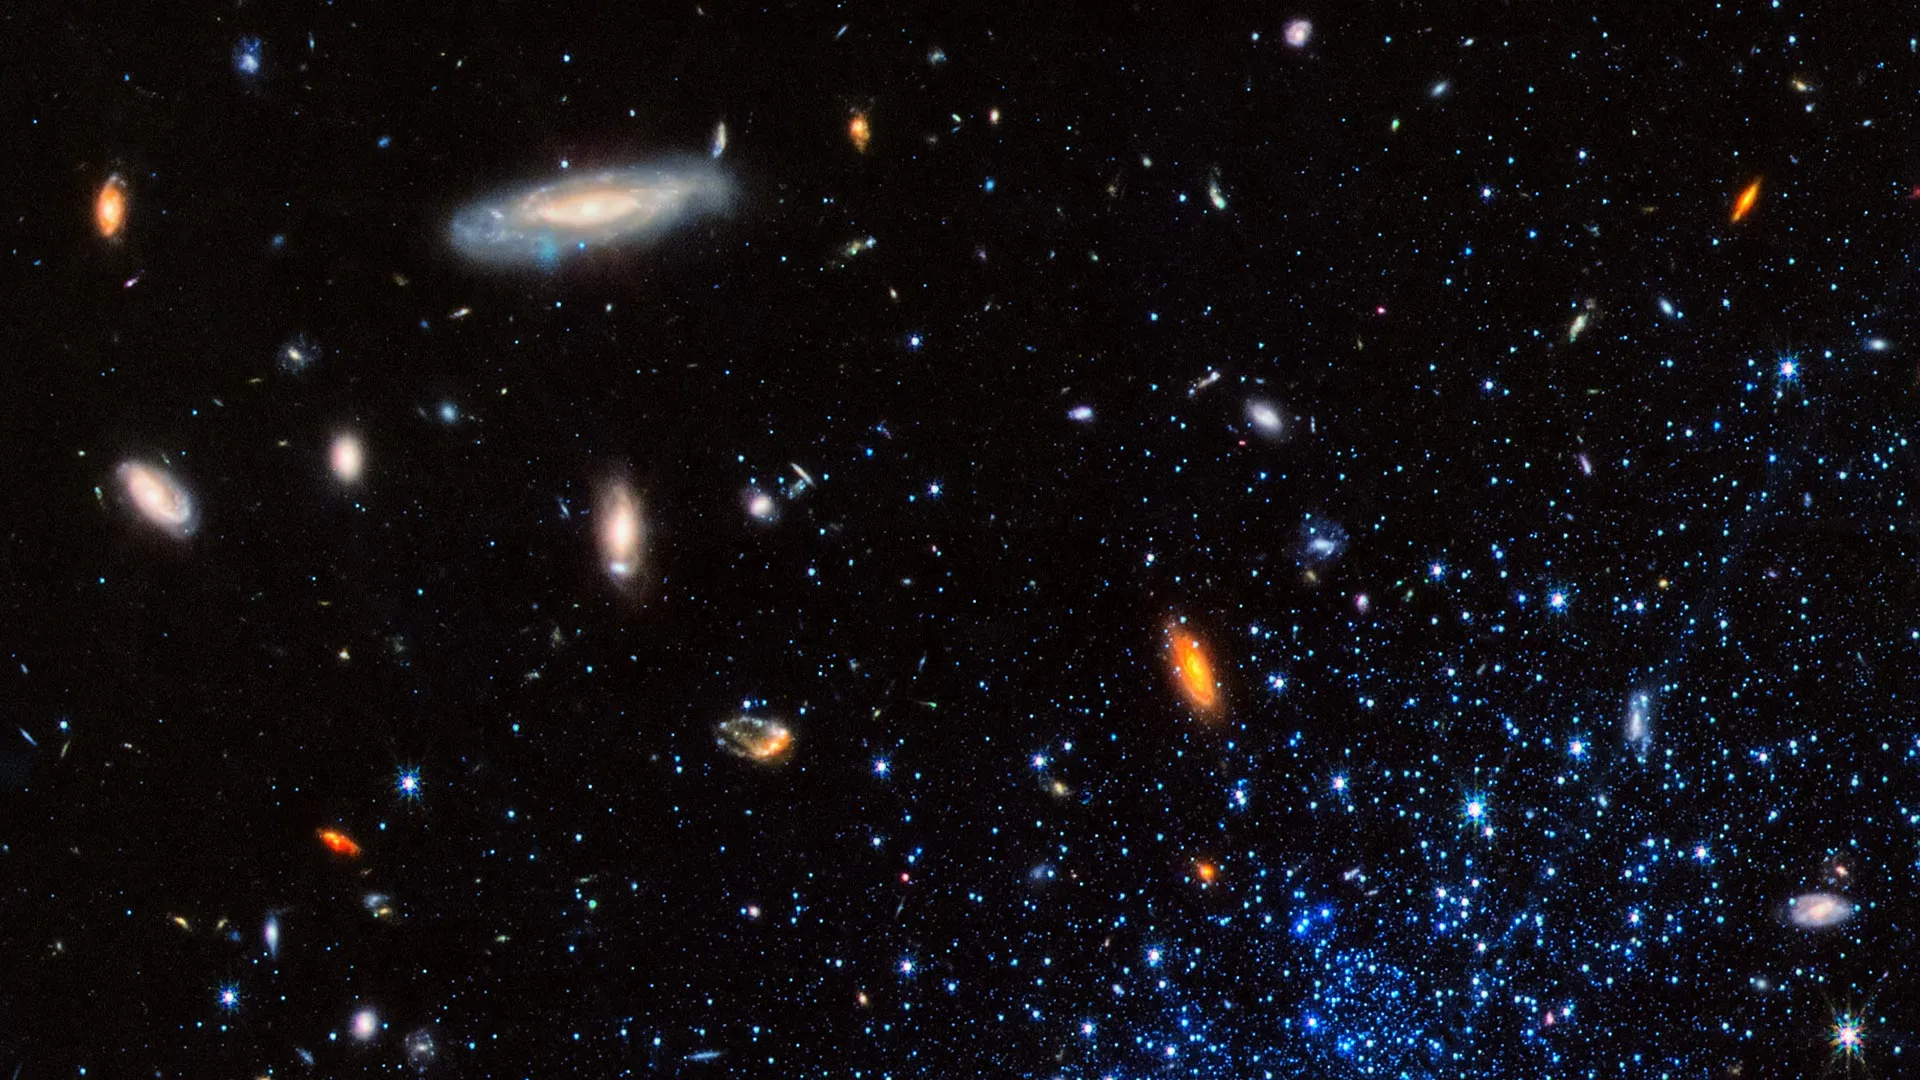
Scientists have measured the amount of helium produced during the Universe’s first five minutes with unprecedented precision, offering a clearer picture of the conditions that existed shortly after the Big Bang. The achievement, made by an international research team that includes scientists from the University of Minnesota Twin Cities, represents a major advance in precision cosmology.
The findings, presented in five papers published in The Astrophysical Journal, are based on 130 hours of observations using the Large Binocular Telescope. By analyzing distant galaxies, the researchers reduced the uncertainty in this fundamental measurement to just 0.5%, making it three times more precise than previous estimates.
The improved accuracy provides scientists with a powerful new tool for investigating the origins of the Universe and testing the Standard Model of physics. Such fundamental tests have a long history of advancing scientific understanding and contributing to technological breakthroughs.
“This is a physics experiment on a grand scale and one of the biggest findings in my entire 40-year career,” said Evan Skillman, University of Minnesota College of Science and Engineering Distinguished Professor in the School of Physics and Astronomy. “It’s a fundamental number that tells us specifically about the conditions of our Universe in its first five minutes. It has diagnostic power that speaks directly to the Standard Model of Physics.”
Why Helium Holds Clues to the Big Bang
According to the Big Bang theory, the Universe began expanding from an extraordinarily hot, dense state approximately 13.8 billion years ago. Three major lines of evidence support this explanation: the continuing expansion of the Universe, the cosmic microwave background radiation, and the amounts of light elements such as helium and deuterium that formed during its earliest moments.
Although cosmic expansion and the microwave background have been studied extensively, measurements of primordial helium have historically received less attention. Determining its original abundance more accurately allows researchers to investigate the physical conditions that prevailed when the Universe was only minutes old.
To achieve their new level of precision, the team departed from the conventional method of estimating primordial helium. That approach involves observing large numbers of galaxies and extrapolating the results to determine how much helium existed before later generations of stars altered their chemical composition.
Instead, the researchers selected 15 exceptionally pristine, small, distant galaxies. These galaxies have undergone relatively little chemical evolution, making them valuable cosmic “time capsules” that preserve clues about the Universe’s early composition.
Powerful Telescopes Deliver Record Precision
The team used sophisticated spectrographs developed at Ohio State University to examine more than 10 helium spectral lines and 15 hydrogen lines simultaneously. Studying these signals together made it possible to identify and correct subtle sources of measurement error that earlier studies could largely overlook.
Such small effects become especially important when researchers are trying to reduce uncertainty to less than 1%. Accounting for them was essential to achieving the new 0.5% precision.
“The MODS spectrographs took 12 years to build from conception to first light on sky,” said Richard Pogge, College of Arts and Sciences Distinguished Professor of Astronomy at Ohio State University. “This is the kind of project we designed them to do, and to see them deliver is enormously satisfying. It’s not every day you can help build instruments that measure something fundamental about our Universe.”
Testing the Fundamental Laws of Physics
Beyond refining estimates of the Universe’s earliest chemical composition, the new measurement provides an important test of the Standard Model of physics. The amount of helium created shortly after the Big Bang depends on the physical conditions at that time, including the types of elementary particles present.
Using their precise helium measurement, the researchers were able to calculate the number of neutrino families in the early Universe. Neutrinos are extremely light subatomic particles, and their behavior plays an important role in scientists’ understanding of fundamental physics.
The results therefore do more than strengthen existing evidence for the Big Bang. They also offer a more precise way to check whether established physical theories accurately describe the Universe during its first few minutes.
“We promised a half-percent uncertainty in our proposal, and we got there,” added Skillman. “In the unpredictable world of science, that doesn’t happen very often.”
The international collaboration brought together scientists from the University of Minnesota Twin Cities, Ohio State University, Gonzaga University, Northwestern University, The University of Texas at Austin, Indiana University, University of California Santa Cruz, University of Illinois, Universidad Nacional Autónoma de México, and TRIUMF.
AI may help doctors judge how ill a patient is using a single photograph of their face, say US researchers.
Can activities like yoga, dance and fitness encourage more girls to enjoy sport?
For the last two years Megan has been in agony and unable to stand straight because of her ketamine use.
On the evening of Aug. 9, 2025, passengers on the Hanse Explorer finished taking selfies and videos of the South Sawyer Glacier, and the ship headed back down the fjord. Twelve hours later, a landslide from the adjacent mountain unexpectedly collapsed into the fjord, initiating the second-highest tsunami in recorded history.
We conduct research on earthquakes and tsunamis at the Alaska Earthquake Center, and one of us serves as Alaska state seismologist. In a new study with colleagues, we detail how that landslide sent water and debris 1,580 feet (481 meters) up the other side of the fjord – higher than the top floor of the Taipei 101 skyscraper – and then continued down Tracy Arm. The force of the water stripped the fjord’s walls down to bare rock.
It was just after 5 o’clock in the morning on a dreary day, and fortunately, no ships were nearby. In the months after, some cruise lines started avoiding Tracy Arm. However, the conditions that led to this event are not at all unique to this fjord.
Landslides are common in the coastal mountains of Alaska where rapid uplift, caused by tectonic forces and long-term ice loss, converges with the erosive forces of precipitation and moving glaciers. But a curious pattern has emerged in recent years: Multiple major landslides have occurred precisely at the terminus of a retreating glacier.
Though the mechanics are still poorly understood, these mountains appear to become unstable when the ice disappears. When the landslide hits the water, the momentum of millions of tons of rock is transferred into tsunami waves.
This same phenomenon is playing out from Alaska to Greenland and Norway, sometimes with deadly consequences. Across the Arctic, countries are trying to come to terms with this growing hazard. The options are not attractive: avoid vast swaths of coastline, or live with a poorly understood risk. We believe there is an obvious role for alert systems, but only if scientists have a better understanding of where and when landslides are likely to occur.
The Tracy Arm landslide is a powerful example.
The landslide occurred in August, when warm ocean waters and heavier precipitation favor both glacier retreat and slope failure. The glacier below the landslide area had experienced rapid calving – large chunks of ice breaking off and falling into the water – and it had retreated more than a third of a mile in the two months prior. Heavy rain had been falling. Rain enters fractures in the mountain and pushes them closer to failure by increasing the water pressure in cracks.
Most provocative are the thousands of small seismic tremors that emanated from the area of the slide in the days prior to the mountainside collapsing.
We believe that this combination of signs would have been sufficient to issue progressive alerts to any ships in the vicinity and homes and businesses that could have been harmed by a tsunami at least a day prior to the failure – had a monitoring program existed.
Escalating alerts are used for everything from terrorism and nuclear plant safety to avalanches and volcanic unrest. They don’t remove the risk, but they do make it easier for people to safely coexist with hazards.
For example, though people are still killed in avalanches, alert systems have played an essential role in making winter backcountry travel safer for more people. The collapse at Tracy Arm demonstrates what could be possible for landslides.
We believe that the combination of weather and rapid glacier retreat in early August 2025 was likely sufficient to issue an alert notifying people that the hazard may be temporarily elevated in a general area. On a yellow-orange-red scale, this would be a yellow alert.
In the hours prior to the landslide, the exponential increase in seismic events and telltale transition to what is known as seismic tremor – a continuous “hum” of seismic energy – were sufficient to communicate a time-sensitive warning for a specific region.
These observations, recorded as a byproduct of regional earthquake monitoring, warranted an “orange” alert noting immediate concern. The signs were arguably sufficient to recommend keeping boats and ships out of the fjord.
Our research over the past few years has demonstrated that once a large landslide has started, it is possible to detect and measure the event within a couple of minutes. In this amount of time, seismic waves in the surrounding area can indicate the rough size of the landslide and whether it occurred near open water.
A monitoring program that could quickly communicate this would be able to issue a red alert, signaling an event in progress.
The National Oceanic and Atmospheric Administration’s tsunami warning program has spent decades fine-tuning rapid message dissemination. A warning system would have offered little help for ships in the immediate vicinity, but it could have provided perhaps 10 minutes of warning for those who rode out the harrowing tsunami farther away.
There is no landslide monitoring system operating yet at this scale in the U.S. Building one will require cooperation across state and federal agencies, and strengthened monitoring and communication networks. Even then, it will not be fail-proof.
Alert systems do not remove the risk entirely, but they are a better option than no warning at all. Over time, they also build awareness as communities and visitors get used to thinking about these hazards.
Many of the most alluring places on Earth come with significant hazards. Arctic fjords are among them. The same processes that create this hazard – glacier retreat, steep terrain, dynamic geology – are also what make these landscapes so compelling. The mix of glaciers, ice-choked waters and steep mountains is exactly what draws people to these places. People will continue to visit and experience them.
The question is not whether these places should be avoided altogether, but how to help people make more informed decisions. We believe that stronger geophysical and meteorological monitoring, coupled with new research and communication channels, is the first step.
On Aug. 9, visitors unknowingly passed through a landscape on the cusp of failure. An alert system might have given tour companies and people in the area the information they needed to make more informed choices and avoid being caught by surprise.
