Mammalian meat allergy is a growing problem along Australia’s east coast – and it’s caused by tick bites.


Mammalian meat allergy is a growing problem along Australia’s east coast – and it’s caused by tick bites.
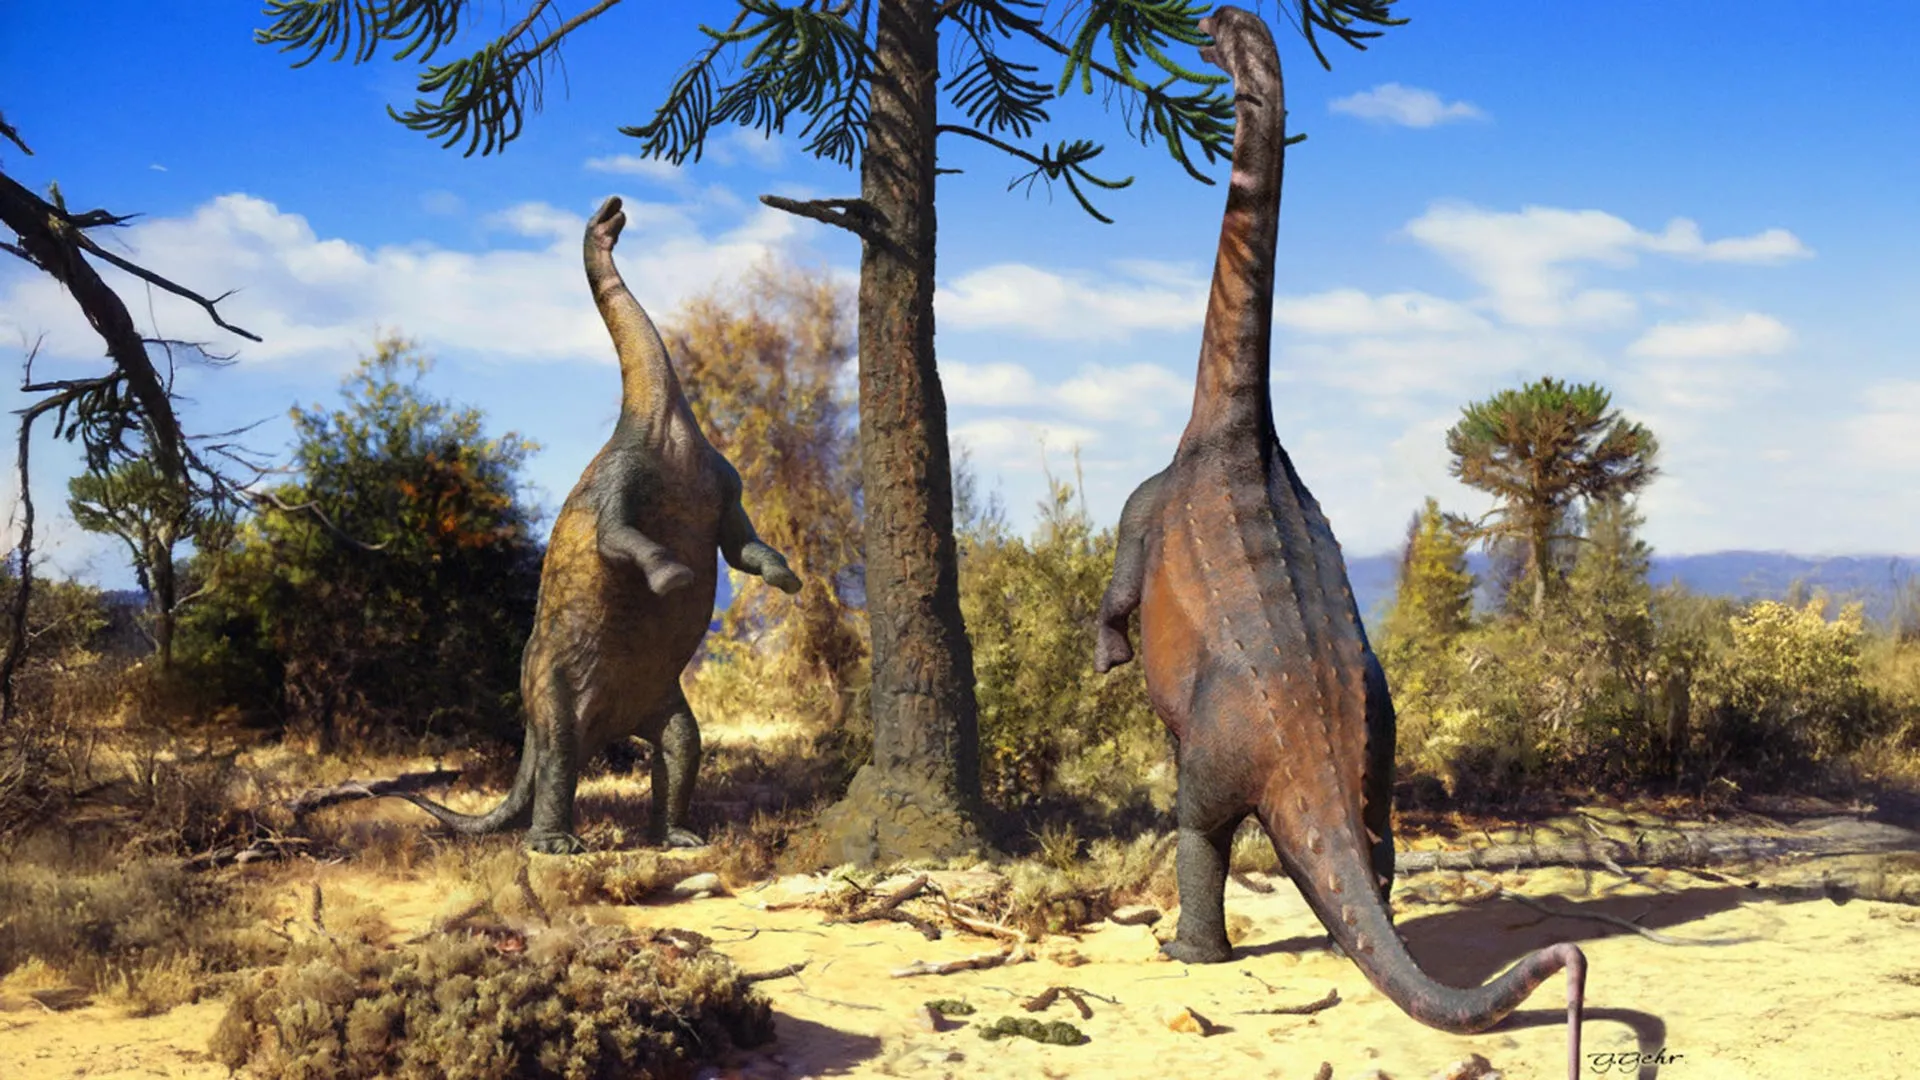
Some long-necked dinosaurs may have been far more capable of standing upright than their enormous bodies suggest.
About 66 million years ago, two South American sauropods could rise onto their hind legs and remain there for relatively long periods, especially when they were young. This ability may have helped them reach leaves high in trees, appear more intimidating to predators, attract mates, or reproduce.
The dinosaurs, Uberabatitan from Brazil and Neuquensaurus from Argentina, were modest in size compared with the largest sauropods. Even so, they were roughly comparable to modern elephants. Adult Uberabatitans may have grown as long as 26 meters, making them the largest dinosaurs known from Brazil.
New research suggests that their ability to stand upright declined as they grew. Younger animals were better able to support themselves on two legs, while adults probably experienced much greater strain because of their increasing weight.
The findings come from a study supported by FAPESP and published in the journal Palaeontology. The international research team included scientists from Brazil, Germany, and Argentina.
Testing Dinosaur Bones With Engineering Tools
To investigate how sauropods handled the forces involved in standing upright, the researchers turned to a computational method commonly used in engineering.
Their goal was to estimate how much stress gravity and body weight placed on the femur, or thigh bone, when each dinosaur shifted its weight onto its hind legs.
“Smaller sauropods like these had a bone and muscle structure that allowed them to stand more easily and for longer on their two hind legs. Larger ones were probably also able to stand, but for a shorter time and with less comfort, since the position caused a lot of stress on the femur,” summarizes Julian Silva Júnior, a postdoctoral researcher at the School of Engineering of São Paulo State University (FEIS-UNESP) in Ilha Solteira, Brazil.
Silva Júnior is the study’s first author. He carried out the research during an internship at the University of Tübingen in Germany with a scholarship from FAPESP.
The team created digital reconstructions of the femurs of seven sauropod species. The selected dinosaurs represented different evolutionary branches, body sizes, and anatomical features. Their models were built from fossils preserved in natural history museums around the world.
Simulating the Forces of Standing Upright
The scientists used finite element analysis (FEA), a method that breaks a structure into many small sections and calculates how each part responds to pressure, weight, heat, or other forces. Engineers often use the same approach to test whether bridges, buildings, and machines can withstand stress.
“Using this technique, we performed two simulations. One dealt with the extrinsic scenario, simulating the force coming from outside to inside. In this case, gravity and the animal’s own weight on the femur when the dinosaur was standing on its hind legs. In the other, we analyzed the intrinsic scenario, the force that the muscles would exert on the femur,” Silva Júnior explains.
By combining the two simulations, the researchers estimated the total stress experienced by the femur of each species.
The lowest stress levels appeared in the two South American sauropods. One was a juvenile Uberabatitan ribeiroi (named after the Brazilian municipality of Uberaba, where it was found, and coincidentally, Silva Júnior’s hometown). The other was Neuquensaurus australis (found near the Neuquén River in Argentina).
Both lived during the Late Cretaceous period, about 66 million years ago.
Stronger Bones Gave Smaller Sauropods an Edge
The researchers found that the two species had particularly robust femurs. Their thicker, sturdier bones were better able to spread out the forces created when the animals stood upright.
“They had more robust femurs and could dissipate stress better. The bigger ones had very large muscles and even giant femurs, but not enough to support their weight. That doesn’t mean they couldn’t stand up, but they probably chose the best time to do so, because it must have been an uncomfortable position,” says the paleontologist.
Larger sauropods may still have been capable of rising onto their hind legs. However, the simulations suggest that they could not hold the pose as comfortably or for as long.
Adult Uberabatitan individuals probably faced the same problem. Although the juvenile examined in the study was well suited to standing upright, fully grown animals would have carried far more weight. That additional mass likely placed them under levels of stress similar to those experienced by other giant sauropods.
Why Sauropods May Have Stood on Two Legs
Standing upright could have provided several important advantages.
Sauropods were plant eaters, so rising onto their hind legs may have allowed them to reach vegetation high in trees that was unavailable to shorter animals. The posture could also have played a role in reproduction by allowing males to mount females or perform visual displays to attract potential mates.
The pose may also have served as a defensive strategy. By lifting the front of the body into the air, a sauropod would have appeared even larger and more threatening to approaching predators.
When supported by both hind legs and the tail, the animal would have formed a tripodal stance, meaning that three points of contact helped stabilize its body.
Important Limits of the Study
The researchers note that their models did not include every structure that would have affected how the dinosaurs stood.
For example, the simulations did not account for cartilage, the flexible tissue that cushions joints and can help absorb and distribute stress. They also did not model the support provided by the tail while the dinosaur was in a tripodal position.
Because cartilage was not analyzed in any of the seven specimens, the researchers assumed that it played a similar role across the species. This means the method is most useful for comparing the dinosaurs with one another rather than producing an exact measurement for each individual animal.
“The tool we use is very efficient for comparisons, even if the answer isn’t exact for each one. By comparing representatives from different lineages, we can get a fairly accurate picture of how these animals behaved millions of years ago,” says the researcher.
The parents of the four naturally-conceived girls were taken by “immense surprise” with the pregnancy, the hospital said.

Scientists led by UC San Diego’s Scripps Institution of Oceanography are warning that oxygen is disappearing rapidly from oceans and freshwater systems, potentially pushing the planet into an “unsafe space.” Some of the resulting changes could persist for centuries and may not be reversible within human lifetimes.
The new review examines aquatic deoxygenation, which refers to declining levels of dissolved oxygen in the ocean (ocean deoxygenation), coastal waters, rivers, lakes and streams. The researchers assessed how this growing problem interacts with the nine major Earth system processes included in the Planetary Boundaries framework.
Introduced in 2009, the framework identifies environmental processes that are essential for maintaining a stable and resilient planet. It also tracks how human activity is pushing those systems beyond safe conditions.
The nine planetary boundaries are climate change, ocean acidification, biodiversity loss, atmospheric aerosol loading, stratospheric ozone depletion, freshwater change, land-use change, chemical pollution and biogeochemical flows (including the nitrogen cycle). The researchers argue that dissolved oxygen levels should also be formally included.
“The health and stability of our planet depends on the health and stability of aquatic ecosystems, which need oxygen to function normally,” said lead author Erica Ferrer, a Scripps Oceanography alumna and current postdoctoral scholar at UC Santa Barbara’s National Center for Ecological Analysis and Synthesis. “This study is designed to elevate the profile of aquatic deoxygenation as a global threat and show that it does not operate in isolation.”
Warming and Pollution Are Draining Oxygen
Human-caused warming, excessive nutrient pollution and changes in the movement and ventilation of deeper waters are the main forces driving aquatic deoxygenation.
As oxygen levels fall, they can disrupt the biological and chemical processes that help regulate Earth’s climate. The decline also threatens organisms across aquatic food webs, from microscopic life to fish and sharks.
Marine mammals can also suffer even though they breathe air at the surface. Oxygen loss can reduce or relocate their prey, damage habitats and alter the food webs they depend on.
Connecting Deoxygenation to Other Planetary Risks
Ferrer and Scripps biological oceanographer Lisa Levin, the study’s senior author, developed the idea for the review after attending COP25, the 2019 United Nations Climate Change Conference held in Madrid.
They hope the findings will encourage researchers and policymakers to examine aquatic oxygen loss alongside climate change, pollution, biodiversity decline and other pressures on the planet rather than treating it as a separate problem.
“Adding aquatic deoxygenation to the Planetary Boundaries framework will help us understand its impacts on Earth system stability,” said Ferrer. “Mitigating its impacts represents a critical component of maintaining biodiversity and climate.”
Research Support and Publication
Ferrer completed the review during her doctoral research at Scripps. Her work was supported by the National Science Foundation’s Graduate Research Fellowship Program, graduate funding from Scripps and UC San Diego, and later postdoctoral support from UC Santa Cruz and UC Santa Barbara.
The study was published June 30, 2026, in the journal Limnology and Oceanography.
Additional authors include four former Scripps PhD students: Shailja Gangrade, Lillian McCormick, Ariel Pezner and Yassir Eddebbar, who is now a Scripps climate scientist. Other contributors were De’Marcus Robinson of UCLA, Véronique Carcon of the Institut de Physique du Globe de Paris and Kevin Rose of the Rensselaer Polytechnic Institute.

Physicists have used an ordinary computer, advanced mathematics, and specialized software to solve a difficult quantum physics problem that had been described as beyond the reach of classical machines.
The work was carried out by researchers at the Center for Computational Quantum Physics (CCQ) at the Simons Foundation’s Flatiron Institute, together with collaborators at Boston University. Their method proved efficient enough for some of the calculations to run on a personal laptop.
By extracting more computing power from conventional hardware, the approach could expand the range of quantum dynamics problems scientists can study. It may also offer a useful strategy for optimization problems in which researchers must identify the best answer among many possible solutions.
The findings were published in the journal Science.
Simulating Hundreds of Interacting Qubits
The challenge involved modeling hundreds of interacting ‘qubits,’ the quantum counterparts of the bits used by traditional computers. The qubits were arranged in square, cubic, or diamond shaped lattices.
A conventional bit stores either a 0 or a 1. A qubit, however, can exist in a superposition of multiple states. This feature gives quantum systems their unusual capabilities, but it also makes their behavior extremely difficult to reproduce on a classical computer.
In a March 2025 article, also published in Science, another research team reported using a quantum computer to calculate the dynamics of an especially complex qubit system. That team argued that a classical computer could not match the achievement.
“Whenever we [at the CCQ] see these kinds of claims, we’re always a bit skeptical,” says Joseph Tindall, an associate research scientist at the CCQ and first author on the new Science paper. “Like, ‘Did you try this? Did you try that?'”
For the CCQ researchers, the claim offered a compelling way to test the limits of their own techniques.
The problem served as an opportunity to take their tools “out for a test drive,” says study co-author and CCQ research scientist Miles Stoudenmire. “We could have picked some more arbitrary target,” Stoudenmire says. “But it was like ‘Why not pick this one that has a big claim attached to it?'”
The Challenge of Quantum Entanglement
One of the greatest obstacles was quantum entanglement. When qubits become entangled, their properties remain connected, even when the qubits are separated by large distances. As a result, researchers cannot model each qubit independently.
Instead, sophisticated algorithms are needed to describe the entire system.
“When you have lots of particles that interact by quantum physics, you have this wave function that describes the state of the system,” Tindall says. “It’s this huge object that rapidly gets bigger and bigger the more particles there are.”
The wave function contains the information needed to describe the quantum system, but its size increases exponentially as more particles are added.
As the wave function’s size grows exponentially, “I just can’t directly store it on my computer,” he says. Working with such enormous wave functions is a recurring problem in quantum physics. Yet these calculations are essential for predicting the behavior of quantum materials, including superconductors.
Compressing a Vast Quantum System
The researchers overcame this barrier by developing and applying new tools based on tensor networks. These mathematical structures compress the information contained in a wave function so that it can be handled more efficiently.
Tindall compares the approach to “a zip file for the wave function where you’ve taken all this information, and you’ve compressed it into this mathematical data structure full of these small tables of numbers that are interconnected to each other.”
That compression made the simulation manageable on classical computers. Tindall completed many of the first calculations on a laptop using ITensor, a high-performance tensor network software library created at the CCQ.
The new simulations also demonstrate how the ITensor team is adapting tensor techniques for new types of problems. In this case, the researchers modeled three-dimensional quantum dynamics with a 3D tensor network.
“It’s this very powerful compression that can be very effective, but it’s a pretty complex mathematical object,” Tindall says. “This really is a bit of a frontier, because working with these objects — especially in three dimensions — is very untrodden. You need sophisticated codes and algorithms to deal with them; it’s a software engineering challenge in itself.”
An Older Algorithm Finds a New Use
Many of the simulations required only relatively modest computing resources. For the early calculations, Tindall used belief propagation, an algorithm developed in the 1980s that researchers have recently adapted for quantum systems.
“It’s a little more approximate than some of the other methods, but it’s way cheaper, and we can run it much more directly on lots of harder problems,” Stoudenmire says.
He contrasts that with “more sophisticated methods in the past of our field” that “wouldn’t be able to even start going for some of these three-dimensional problems, because they’re so big.”
Although the hardware was modest, the results reached state-of-the-art levels of accuracy. The simulations produced solutions that aligned with theoretical predictions and performed well on smaller problems where the correct answers could be checked.
Most importantly, the results agreed with those previously obtained using a quantum computer. The difference was that the new calculations did not require quantum hardware.
Classical and Quantum Computing Can Work Together
The findings add to the debate over where classical computing ends and quantum advantage begins. However, Tindall and Stoudenmire emphasize that the two fields are not simply competing with each other.
Classical simulations can help researchers understand what quantum computers are capable of doing, while progress in quantum hardware can inspire new classical methods.
“The good side of the classical versus quantum computing debate is that there’s a lot of synergy between the kind of simulations we’re interested in and the codes we write and what can be realized on these quantum computers,” Tindall says. “That can help guide us, and it can also help guide quantum computing researchers, because, obviously, the barrier for entry for us to simulate certain things is a lot easier than for them, because we don’t have to build a quantum computer. I can just write some code and press ‘run’ on my personal computer.”
The Next Quantum Simulation Challenge
The researchers are now developing methods that go beyond systems made only of qubits. Their next goal is to model electrons that can move between different sites.
These systems are significantly more difficult to simulate, but they are also directly relevant to understanding real quantum materials.
“They’re really, quantitatively, a lot harder problems,” Stoudenmire says. “So that’s one of our next big bars that we want to clear.”
Anita Le Brun, the face of a campaign to allow for alcohol to be served at care homes without a licence, is celebrating its success.
Ravika is one of hundreds of women who are noticing early pregnancy signs through the data on their fitness trackers.
Do you sometimes notice a deep buzzing or humming noise that seems to have no identifiable source? If so, you may be among the estimated 2-4 percent of people worldwide who experience this unusual sound. Researchers have spent decades trying to determine where it originates.
For some, the noise is irritating but manageable. For others, the low-frequency sound can cause physical discomfort or illness and may also feel like a vibration moving through the body.
The hum can be difficult to detect outdoors. It is more commonly noticed inside buildings, especially at night when people are trying to sleep. Someone may look outside for a nearby engine or machine, only to find nothing that could explain the noise.
Even more puzzling, other people in the same room may hear nothing at all.
Reports of The Hum Begin in England
The phenomenon first gained widespread attention in Bristol, England, during the mid-1970s. The Bristol Evening Post began receiving a stream of letters from residents who described hearing an unexplained sound and wanted to know what was producing it.
One proposed explanation pointed to large industrial fans operating inside a department store warehouse. Yet the reports continued even after the warehouse closed several years later.
Similar accounts later emerged elsewhere in the United Kingdom, particularly in coastal communities including Hythe, Plymouth, Southampton and Swansea. Reports also came from London.
The mysterious sound became known as The Hum phenomenon, or simply The Hum.
During the 1990s, reports began appearing in the United States, initially in Taos, New Mexico and Kokomo, Indiana. The phenomenon has since been documented in Canada, Australia, New Zealand, South Africa and several European cities. Most reports tend to come from relatively densely populated areas.
According to the Norwegian Broadcasting Corporation (NRK), residents around Oslo also reported an unexplained humming noise a couple of years ago.
Canadian teacher Glen MacPherson first heard The Hum while living and working on the west coast of Canada. After moving to another city in the same region, he could no longer hear it.
His curiosity eventually led him to establish the interactive The World Hum Map and Database Project in 2012. The project gathers reports and location data from people who say they have experienced the sound.
Possible Sources Range From Machines to Nature
Researchers and the public have proposed numerous explanations for The Hum. Suggested causes include acoustic pollution from human activity, naturally occurring environmental sounds and conspiracy theories involving the CIA or even aliens.
Many technologies can generate low-frequency noise, including ventilation systems, heat pumps, road traffic and windmills. Nature also produces sounds in this range through sources such as ocean waves striking the shore and wind moving across the landscape.
The mystery has drawn the attention of hearing specialists and audiology researchers around the world. One of them is Markus Drexl, a professor at the Norwegian University of Science and Technology (NTNU).
Drexl, two PhD research fellows and a postdoc studied 28 people in Germany who reported hearing an unexplained hum or buzz.
Testing Whether the Hum Comes From Outside
The researchers examined two main hypotheses.
The first was that The Hum might be an externally produced sound that could be measured. Such noise could come from industry, infrastructure or natural processes that generate low-frequency waves.
“We know that there are people who hear low-frequency sounds that can actually be measured, even if other people don’t hear them. But it’s not so easy to find the source of these sound waves, because it’s a struggle to localize low-frequency sounds,” Drexl said.
Low-frequency sound waves have long wavelengths, which allows them to travel across considerable distances. That makes their source especially difficult to pinpoint.
Most Participants Did Not Have Exceptional Hearing
The team first investigated whether the participants were unusually sensitive to known low-frequency sounds.
Most showed no exceptional ability in this range. Only two people had better than average hearing at certain low frequencies.
“Even though the group we tested was small, it still means that the hypothesis of having especially good hearing for low-frequency sounds does not hold for most people,” Drexl said.
However, he noted an important limitation. Tiny variations in hearing thresholds (microstructures) may allow some people to detect sound within an extremely narrow frequency range, such as between 50 and 51 Hertz. Standard hearing tests are not designed to capture differences this precise.
Could the Inner Ear Be Producing the Noise?
The cochlea inside the inner ear naturally creates faint sounds at different frequencies, generally between about 500 and 5000 Hertz. These noises do not serve a direct purpose. Instead, they are a by-product of the ear’s physiological sound amplification process.
“Most of us don’t hear these sounds. However, a few people can actually hear the sounds that the ear itself produces. And these sounds can be measured objectively,” Drexl said.
Known as oto-acoustic emissions, these sounds can be detected by placing a sensitive microphone inside the ear canal. In certain individuals, spontaneous oto-acoustic emissions may be perceived as distressing tinnitus.
“One hypothesis was that the participants in our group could hear oto-acoustic emissions at low frequencies. That’s why we tested whether they had them,” says Drexl.
But… the answer was no.
Low-Frequency Tinnitus May Explain Many Cases
“Then there are people who hear something that cannot be measured objectively. We believe people in this category have a form of low-frequency tinnitus,” Drexl said.
Tinnitus, often described as ringing in the ears, occurs when someone perceives a sound inside the ear or head even though no external source is producing it.
Tinnitus may be temporary or persistent. People often initially interpret the sound as something coming from their surroundings.
When the noise continues after they change locations, however, they may eventually realize that it is not being generated by anything nearby.
Based on current knowledge of hearing and the results of the participant tests, Drexl believes the most likely explanation has two parts.
A small number of people who hear The Hum may genuinely have unusually sensitive low-frequency hearing. For most, however, the experience may be a type of tinnitus in which the sound begins within the auditory system.
“Based on our results, although we haven’t ruled out cases of physical external sound sources, we suggest that subjective tinnitus in the low-frequency range is often the cause of hearing pulsations of low-frequency sound perceptions,” he said.
Scientists Need a Better Picture of Low-Frequency Hearing
Drexl became interested in The Hum through his research into low-frequency sound.
“What we know about the hearing system is mainly based on how we capture and process sound with higher frequencies. We know less about how the auditory system handles and processes low-frequency sound, or infrasound,” he said.
Concern about noise from technological sources has increased during the past decade, particularly for sounds in the low-frequency range (between about 20 and 250 Hz) and infrasound (below 20 Hz).
“If we want to conduct a thorough assessment of low-frequency sounds and infrasound, we first need a better understanding of how sensory systems process low-frequency sound and infrasound,” he said.

Coffee has repeatedly been associated with longer life and a lower risk of several chronic illnesses. Even so, scientists have not fully understood the biological processes that might explain those benefits.
New findings from the Texas A&M College of Veterinary Medicine and Biomedical Sciences (VMBS) point to one possible answer. Researchers found that certain compounds in coffee may activate NR4A1, a receptor that is becoming increasingly important in studies of aging, stress responses and disease.
The research, recently published in Nutrients, offers one of the first direct links between coffee compounds and NR4A1. That connection may help explain some of the broad health effects associated with drinking coffee.
“Coffee has well-known health-promoting properties,” said Dr. Stephen Safe, distinguished professor and Sid Kyle Endowed Chair in Veterinary Toxicology in VMBS’ Department of Veterinary Physiology and Pharmacology. “What we’ve shown is that some of those effects may be linked to how coffee compounds interact with this receptor, which is involved in protecting the body from stress-induced damage.”
How NR4A1 Helps Protect the Body
NR4A1 is part of a group of nuclear receptors that help control gene activity when the body is exposed to stress or tissue damage.
In earlier research, Safe and his collaborators described NR4A1 as a “nutrient sensor,” meaning that it can respond to dietary compounds and contribute to the body’s ability to remain healthy with age.
“If you damage almost any tissue, NR4A1 responds to bring that damage down,” Safe said. “If you take that receptor away, the damage is worse.”
Studies have connected NR4A1 with inflammation, metabolism and tissue repair. Each of these processes is closely involved in age-related conditions, including cancer, neurodegenerative disease and metabolic disorders.
A Possible Mechanism Behind Coffee’s Benefits
Large observational studies have linked coffee consumption with a reduced risk of Alzheimer’s disease, Parkinson’s disease and metabolic disease. However, those studies have generally shown associations rather than explaining exactly how coffee might produce protective effects.
Safe and his team proposed that NR4A1 could be one part of that explanation.
The project involved researchers from across Texas A&M, including Dr. Robert Chapkin, Dr. Roger Norton, Dr. James Cai and Dr. Shoshana Eitan. Their work helped show coffee’s protective effects in neurological models.
The researchers found that several compounds in coffee can bind to NR4A1 and alter its activity. The most active included polyhydroxy and polyphenolic compounds such as caffeic acid.
“What we’re saying is that at least part of coffee’s health benefits may come through binding and activating this receptor,” Safe said.
In laboratory models, these compounds also changed cell behavior in ways associated with disease protection. They reduced cellular damage and slowed the growth of cancer cells.
When the researchers removed NR4A1 from the cells, those protective effects disappeared. That result provided additional evidence that the receptor helps mediate at least some of coffee’s biological effects.
Coffee’s Benefits May Extend Beyond Caffeine
Caffeine is the largest individual component in coffee, but the study indicates that it may not be the main source of the beverage’s protective effects.
Instead, naturally occurring compounds that are also present in many fruits and vegetables appeared to have a stronger influence on NR4A1.
“Caffeine binds the receptor, but it doesn’t do much in our models,” Safe said. “The polyhydroxy and polyphenolic compounds are much more active.”
This finding may help explain why large population studies have linked both caffeinated and decaffeinated coffee with similar health benefits.
One Pathway Among Many
Safe cautioned that coffee is chemically complex and probably affects the body through multiple biological routes.
“There are many receptors and many mechanisms involved,” he said. “What we’re showing is that this could be one of the important pathways.”
The study was designed to investigate biological mechanisms. It does not establish direct cause and effect in people or prove that drinking coffee prevents disease.
“There’s still a lot of work to be done,” Safe said. “We’ve made the connection, but we need to better understand how important that connection is.”
The results support a growing body of research showing that diet, especially plant-based compounds, can influence biological pathways involved in aging and disease.
Because NR4A1 plays a role in several medical conditions, the findings may also contribute to future drug development. Safe’s team is studying synthetic compounds that target the receptor more effectively than natural dietary substances, with the aim of developing possible treatments for cancer and other diseases.
The work also highlights the potential importance of routine dietary choices.
“Coffee is a very complex mixture of compounds,” Safe said. “It’s a very potent combination.”
What the Findings Mean for Coffee Drinkers
The research does not change current recommendations for coffee consumption. People can also respond differently depending on their health, sensitivity to caffeine and other individual factors.
Still, the findings provide scientists with something that has been difficult to identify: a possible biological explanation for coffee’s long-standing association with better health and longevity.
“I think it helps explain why coffee has the effects that it does,” Safe said. “It’s not just an observation — there’s a mechanism behind it.”
Three women describe how endometriosis has affected their careers, as an inquiry takes place.