Claire Harkin believes the experiences of people who are supporting loved ones with an addiction can be overlooked.


Claire Harkin believes the experiences of people who are supporting loved ones with an addiction can be overlooked.

Scientists have uncovered something surprising in the Atlantic Ocean. The majority of plastic pollution may no longer be visible at all. Instead, it exists as nanoplastics, particles so small they are measured in billionths of a meter.
“This estimate shows that there is more plastic in the form of nanoparticles floating in this part of the ocean than there is in larger micro- or macroplastics floating in the Atlantic or even all the world’s oceans!” said Helge Niemann, researcher at NIOZ and professor of geochemistry at Utrecht University. In mid-June, he received a 3.5 million euro grant to further investigate nanoplastics and what ultimately happens to them.
Ocean Expedition Reveals Tiny Plastic Particles
To gather data, Utrecht master’s student Sophie ten Hietbrink spent four weeks aboard the research vessel RV Pelagia. The ship traveled from the Azores to the European continental shelf, where she collected water samples at 12 different locations.
Each sample was carefully filtered to remove anything larger than one micrometer. What remained contained the smallest particles. “By drying and heating the remaining material, we were able to measure the characteristic molecules of different types of plastics in the Utrecht laboratory, using mass spectrometry,” Ten Hietbrink explains.
First Real Estimate of Ocean Nanoplastics
Previous studies had confirmed that nanoplastics existed in ocean water, but no one had been able to calculate how much was actually there. This research marks the first time scientists have produced a meaningful estimate.
Niemann notes that this breakthrough was made possible by combining ocean research with expertise from atmospheric science, including contributions from Utrecht University scientist Dusân Materic.
27 Million Tons of Invisible Plastic
When the team scaled their measurements across the North Atlantic, the results were striking. They estimate that about 27 million tons of nanoplastics are floating in this region alone.
“A shocking amount,” Ten Hietbrink says. The finding may finally explain a long-standing mystery. Scientists have struggled to account for all the plastic ever produced. Much of it appeared to be missing. This study suggests that a large share has broken down into tiny particles that are now suspended throughout the ocean.
How Nanoplastics Enter the Ocean
These microscopic plastics come from multiple sources. Larger plastic debris can fragment over time due to sunlight. Rivers also carry plastic particles from land into the sea.
Another pathway comes from the atmosphere. Nanoplastics can travel through the air and fall into the ocean with rain or settle directly onto the water’s surface through a process known as dry deposition.
Potential Risks to Ecosystems and Human Health
The widespread presence of nanoplastics raises serious concerns. Niemann points out that these particles are small enough to enter living organisms.
“It is already known that nanoplastics can penetrate deep into our bodies. They are even found in brain tissue,” he says. Because they are now known to be present throughout the ocean, they likely move through entire food webs, from microorganisms to fish and ultimately to humans. The full impact on ecosystems and health is still unclear and requires further study.
What Scientists Still Don’t Know
There are still important gaps in knowledge. Researchers did not detect certain common plastics, such as polyethylene or polypropylene, in the smallest particle range.
“It may well be that those were masked by other molecules in the study,” Niemann says. The team also wants to determine whether similar levels of nanoplastics exist in other oceans. Early indications suggest this could be the case, but more research is needed.
Prevention May Be the Only Solution
While this discovery fills a critical gap in understanding ocean pollution, it also presents a difficult reality. These particles are too small and too widespread to remove.
“The nanoplastics that are there can never be cleaned up,” Niemann emphasizes. The findings highlight the urgency of preventing further plastic pollution before it breaks down into an even more persistent and invisible problem.
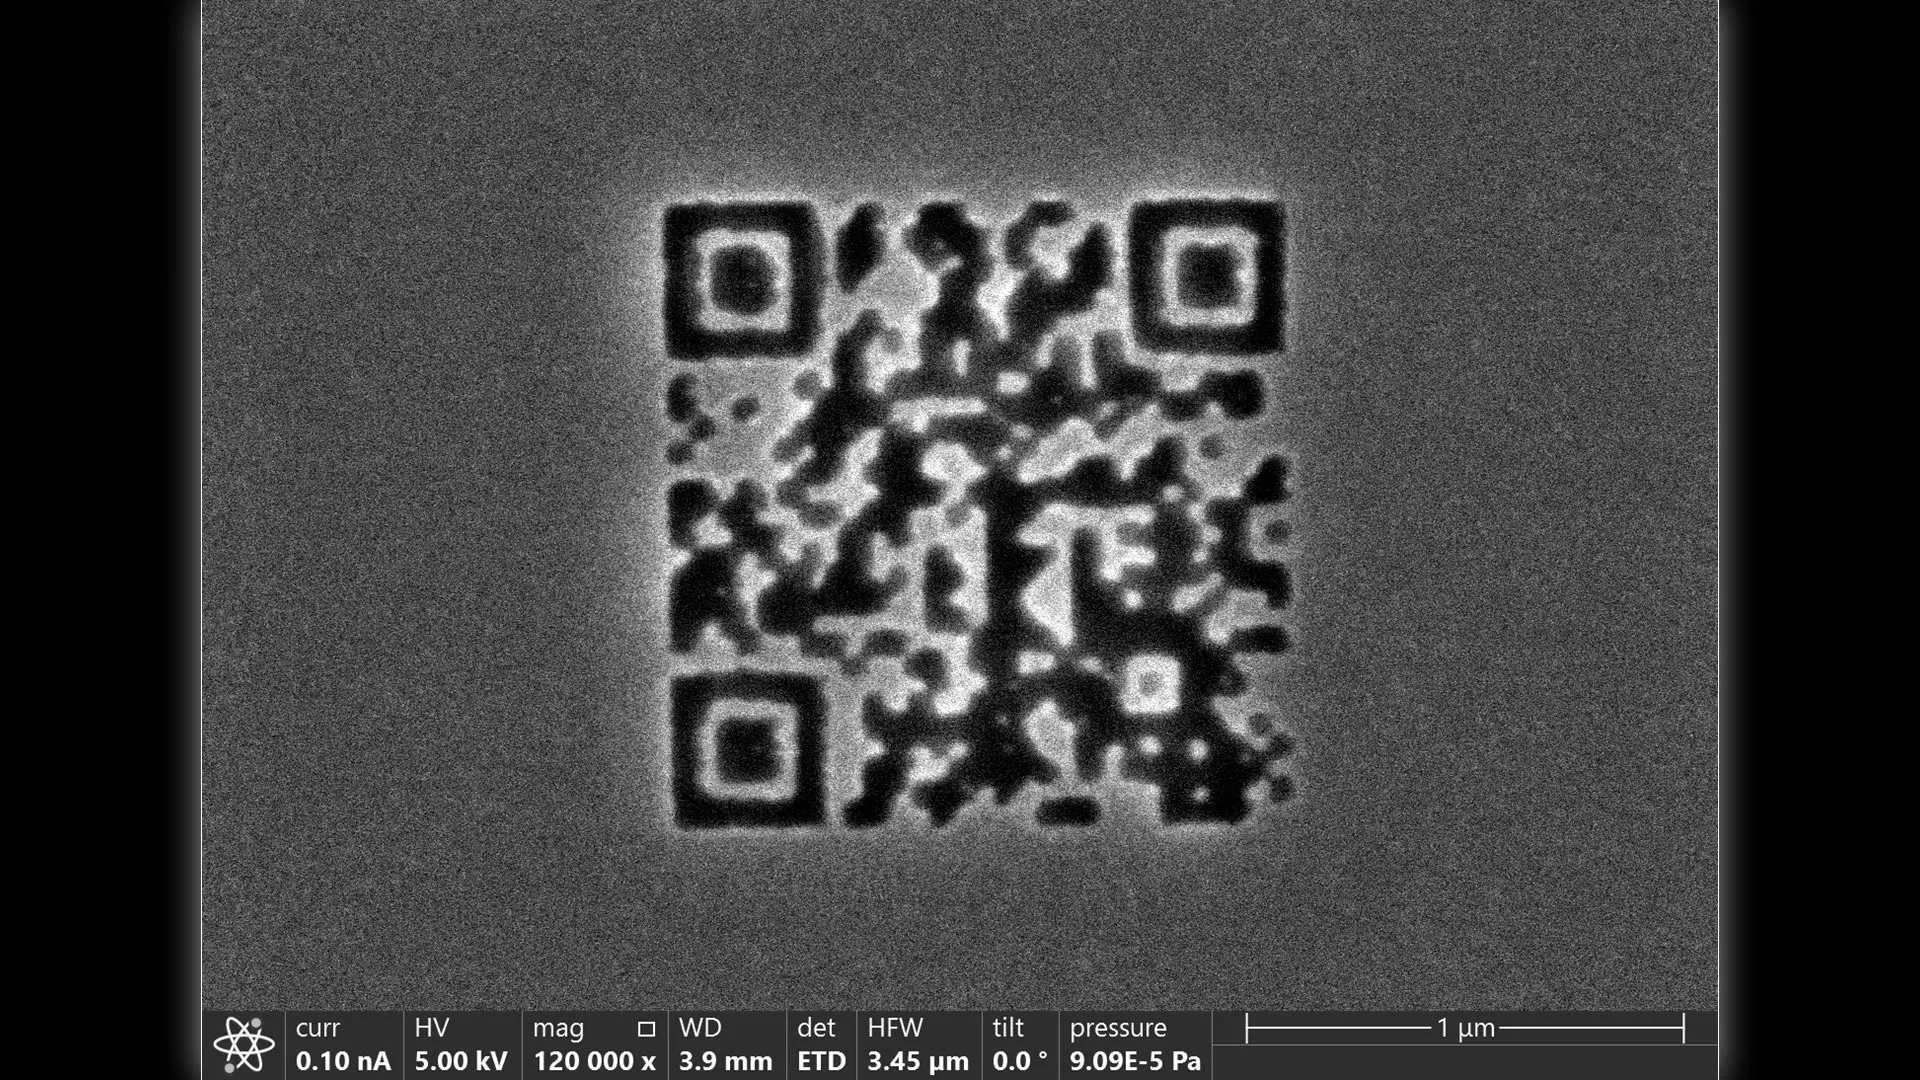
How small can a QR code get? A team of researchers has pushed the limits to an extreme, creating one so tiny it can only be detected using an electron microscope. Scientists at TU Wien, working with data storage company Cerabyte, produced a QR code measuring just 1.98 square micrometers, which is smaller than most bacteria. This achievement has now been officially confirmed and recorded in the Guinness Book of Records.
Beyond its size, the breakthrough could have major implications for long-term data storage. Traditional storage technologies such as magnetic drives or electronic systems tend to degrade within a few years. In contrast, encoding information into ceramic materials could preserve it for hundreds or even thousands of years.
Stable and Readable at the Nanoscale
“The structure we have created here is so fine that it cannot be seen with optical microscopes at all,” says Prof. Paul Mayrhofer from TU Wien’s Institute of Materials Science and Technology. “But that is not even the truly remarkable part. Structures on the micrometer scale are nothing unusual today — it is even possible to fabricate patterns made of individual atoms. However, that alone does not result in a stable, readable code.”
At extremely small scales, atoms can shift positions or fill gaps, which can erase stored data. “What we have done is something fundamentally different,” Mayrhofer explains. “We have created a tiny, but stable and repeatedly readable QR code.”
Ceramic Materials Enable Durable Data Storage
The key to this achievement lies in the material itself. “We conduct research on thin ceramic films, such as those used for coating high-performance cutting tools,” explain Erwin Peck and Balint Hajas. “For high-performance tools, it is essential that materials remain stable and durable even under extreme conditions. And that is exactly what makes these materials ideal for data storage as well.”
Using focused ion beams, the researchers engraved the QR code into a thin ceramic layer. Each pixel measures just 49 nanometers, which is about ten times smaller than the wavelength of visible light. As a result, the pattern is completely invisible under normal conditions and cannot be resolved using visible light. However, when viewed with an electron microscope, the QR code can be clearly and reliably read.
The storage capacity is also impressive. More than 2 terabytes of data could fit within the area of a single A4 sheet of paper using this approach. Unlike conventional storage systems, these ceramic data carriers can remain intact indefinitely and do not require any energy to maintain the stored information.
A New Approach to Long-Term Data Preservation
“We live in the information age, yet we store our knowledge in media that are astonishingly short-lived,” says Alexander Kirnbauer. Magnetic and electronic storage devices often lose data after only a few years, especially without continuous power, cooling, and maintenance. In contrast, ancient civilizations carved their knowledge into stone, allowing it to survive for thousands of years.
“With ceramic storage media, we are pursuing a similar approach to that of ancient cultures, whose inscriptions we can still read today,” Kirnbauer says. “We write information into stable, inert materials that can withstand the passage of time and remain fully accessible to future generations.”
Another major advantage is energy efficiency. Unlike modern data centers that require significant electricity and cooling, ceramic-based storage can preserve information without any ongoing energy input, helping reduce environmental impact.
Guinness Record and Future Applications
The record-setting QR code and its verification process, including electron microscope readout, were conducted jointly by TU Wien and Cerabyte in front of witnesses. The University of Vienna served as an independent verifier. TU Wien provided advanced materials science facilities along with the high-resolution electron microscopes at its USTEM center. The result has now been officially recognized by Guinness, with the new QR code measuring just 37% the size of the previous record holder.
“The now confirmed world record marks just the beginning of a very promising development,” says Alexander Kirnbauer. “We now aim to use other materials, increase writing speeds, and develop scalable manufacturing processes so that ceramic data storage can be used not only in laboratories but also in industrial applications. At the same time, we are investigating how more complex data structures — far beyond simple QR codes — can be written robustly, quickly, and energy-efficiently into ceramic thin films and read out reliably.”
This work points toward a more sustainable future for data storage, where information can be preserved securely for the long term with minimal energy use.

Researchers have developed a new holographic data storage method that records and retrieves information in three dimensions by combining three key properties of light — amplitude, phase and polarization. By using all three together, the approach allows much more data to be stored within the same space, offering a potential solution to the growing global demand for data storage.
Traditional storage systems write data onto flat surfaces such as hard drives or optical discs. In contrast, holographic data storage embeds information throughout the volume of a material using laser light. This creates multiple overlapping light patterns within the same space, which significantly increases storage capacity and enables faster data transfer.
“In conventional holographic data storage, data encoding typically uses one light dimension such as amplitude or phase alone, or, at most, combines two of these dimensions,” said research team leader Xiaodi Tan from Fujian Normal University in China. “Based on the principle of polarization holography, we used a deep learning architecture known as a convolutional neural network model to enable the use of polarization as an independent information dimension.”
The research, published in Optica, Optica Publishing Group’s journal for high-impact research, shows that this new technique can increase how much information is stored while also making it easier to retrieve.
“With further development and commercialization, this type of multidimensional holographic data storage could enable smaller data centers and more efficient large-scale archival storage, while also enhancing data processing and transmission efficiency,” said Tan. “It could also contribute to safer data transmission, optical encryption and advanced imaging.”
Using Polarization to Expand Data Encoding
In holographic storage, information is saved as image-like data pages created by laser light patterns. Encoding converts digital data into these pages, while decoding translates them back into usable information.
Although light has multiple properties that could be used to carry more data, combining them effectively has been difficult in practice. To overcome this, the researchers refined a method called tensor-based polarization holography, which preserves the polarization state of light during reconstruction. This makes polarization a dependable channel for storing additional information.
Building on this work, the team created a 3D modulation encoding strategy. By adjusting the intensity and phase of two perpendicular polarization states and applying a double-phase hologram technique, they enabled a single phase-only spatial light modulator to encode amplitude, phase and polarization together in the optical field.
AI Decoding of Multidimensional Light Data
Decoding this combined information is challenging because standard sensors only measure light intensity (amplitude) and cannot directly detect phase or polarization. To address this, the researchers used tensor-polarization holography theory along with a convolutional neural network to recover all three types of data from diffraction intensity images.
The neural network is trained using two complementary diffraction images, one captured with a vertical polarizer and one without. By analyzing these images, the model learns to identify patterns linked to amplitude, phase and polarization. This allows it to reconstruct all three simultaneously, improving storage density and boosting data transmission speed.
Toward Faster and Higher-Capacity Data Storage
After confirming the concept, the researchers built a compact system capable of recording and reconstructing the encoded optical field within a polarization-sensitive material. During testing, intensity images were analyzed to detect signatures related to amplitude, phase and polarization. These were then used as inputs for the neural network, enabling full 3D reconstruction using only intensity-based measurements.
“Overall, our results showed that multidimensional joint encoding substantially increased the information carried by a single holographic data page, thereby improving storage capacity,” said Tan. “In addition, neural network synchronous decoding reduced the need for complex measurements and step-by-step reconstruction, supporting more efficient readout and decoding. This could enable a practical route toward high-capacity, high-throughput holographic data storage.”
Next Steps for Real-World Applications
The researchers emphasize that the system is still in the research stage and requires further development before it can be used commercially. Future work will focus on increasing the gray levels used in encoding to expand capacity even further, as well as improving the long-term stability, uniformity and repeatability of the recording materials.
They also plan to integrate this method with volumetric holographic multiplexing techniques, which could allow multiple pages and channels of data to be stored at once. Strengthening the integration between optical hardware and decoding algorithms will be essential for achieving faster and more reliable data retrieval under real-world conditions.
People sharing pictures and accounts on socials of red, inflamed skin have triggered the first UK research into TSW.
The Hospice in the Weald in Pembury runs the sessions for people with life-limiting conditions.

Stopping carbon dioxide (CO2) before it enters the atmosphere is a critical way to cut greenhouse gas emissions. While carbon capture has been around for many years, it has not been widely adopted because most systems are costly and inefficient. A common industrial approach, aqueous amine scrubbing, requires heating large amounts of liquid to temperatures above 100 °C to release the captured CO2 and reuse the solution. This high energy demand drives up operating costs and makes large-scale use difficult.
Solid carbon materials have gained attention as a more practical option. These materials are relatively inexpensive and have a large surface area that allows them to trap CO2. They can also release the gas using less heat, especially when they contain nitrogen-based functional groups. However, there has been a key limitation. Traditional manufacturing methods place these nitrogen groups randomly across the material, making it hard to pinpoint which specific arrangements lead to better performance.
To address this challenge, a research team led by Associate Professor Yasuhiro Yamada from the Graduate School of Engineering and Associate Professor Tomonori Ohba from the Graduate School of Science at Chiba University, Japan, developed a new type of carbon material called ‘viciazites.’ These materials are designed with nitrogen groups positioned next to each other in a controlled way. The study, published in the journal Carbon, was co-authored by Mr. Kota Kondo, also from Chiba University.
Building Viciazites With Controlled Nitrogen Pairing
The researchers created three different versions of viciazites, each with a unique type of neighboring nitrogen configuration. To produce adjacent primary amine groups (-NH2 groups), they first heated a compound called coronene, then treated it with bromine, followed by ammonia gas. This three-step method achieved 76% selectivity, meaning most of the nitrogen atoms were placed in the intended positions.
Two additional materials were produced using different starting compounds. One featured adjacent pyrrolic nitrogen with 82% selectivity, while the other contained adjacent pyridinic nitrogen with 60% selectivity.
Verifying Structure and Testing Performance
Each material was applied to activated carbon fibers to create usable samples. The team confirmed the precise placement of nitrogen groups using techniques such as nuclear magnetic resonance spectroscopy, X-ray photoelectron spectroscopy, and computational modeling. These methods verified that the nitrogen atoms were positioned side by side rather than randomly distributed.
When tested, the materials showed clear performance differences. Samples with adjacent -NH2 groups and pyrrolic nitrogen captured more CO2 than untreated carbon fibers. In contrast, the pyridinic nitrogen configuration offered little improvement.
Low-Temperature CO2 Release Could Cut Energy Use
The most notable finding involved how easily the materials released CO2. “Performance evaluation revealed that in carbon materials where NH2 groups are introduced adjacently, most of the adsorbed CO2 desorbs at temperatures below 60 °C. By combining this property with industrial waste heat, it may be possible to achieve efficient CO2 capture processes with substantially reduced operating costs,” highlights Dr. Yamada.
The material containing pyrrolic nitrogen required higher temperatures to release CO2, but it may offer better long-term stability due to its stronger chemical structure.
A New Path Toward Cost-Effective Carbon Capture
This work shows that arranging nitrogen groups in specific adjacent patterns can be done reliably, providing a clear strategy for designing improved carbon capture materials. “Our motivation is to contribute to the future society and to utilize our recently developed carbon materials with controlled structures. This work provides validated pathways to synthesize designer nitrogen-doped carbon materials, offering the molecular-level control essential for developing next-generation, cost-effective, and advanced CO2 capture technologies,” concludes Dr. Yamada.
Beyond capturing CO2, these viciazite materials could also be used for other applications, including removing metal ions or serving as catalysts, thanks to their customizable surface properties.
Funding and Support
This work was supported by Mukai Science and Technology Foundation, Japan Society for the Promotion of Science (JSPS KAKENHI Grant Number JP24K01251), and the “Advanced Research Infrastructure for Materials and Nanotechnology in Japan (ARIM)” of the Ministry of Education, Culture, Sports, Science and Technology (MEXT) under Grant Number JPMXP1225JI0008.

For more than 20 years, astronomers have been puzzled by a striking pattern of bright, evenly spaced stripes in the radio waves coming from the Crab Pulsar, the dense remnant of a supernova recorded by Chinese and Japanese astronomers in 1054.
In 2024, a theoretical astrophysicist at the University of Kansas proposed a solution that explained much of this unusual “zebra” pattern. Now, with a refined analysis, he has identified gravity’s lensing effect as the final missing ingredient needed to fully explain the phenomenon.
“Gravity changes the shape of spacetime,” said Mikhail Medvedev, KU professor of physics & astronomy, who will present his findings at the American Physical Society’s 2026 Global Physics Summit taking place March 15-20 at the Colorado Convention Center in Denver.
An associated paper, accepted by the peer-reviewed Journal of Plasma Physics, currently is available on the pre-print site arXiv.
“Light doesn’t travel in a straight line in a gravitational field because space itself is curved,” he said. “What would be straight in flat spacetime becomes curved in the presence of strong gravity. In that sense, gravity acts as a lens in curved spacetime.”
Gravity and Plasma Create a Unique Cosmic Tug-of-War
While gravitational lensing is well known in studies of black holes, Medvedev says this is the first observed case where both gravity and plasma work together to shape a signal detected from space.
“In black hole images, gravity alone shapes the structure,” he said. “In the Crab Pulsar, both gravity and plasma act together. This represents the first real-world application of this combined effect.”
The Crab Pulsar sits at the center of the Crab Nebula in the Perseus Arm of the Milky Way, about 6,500 light-years from Earth. Its relatively close distance and clear visibility make it a key object for studying neutron stars, supernova remnants, and nebulae.
A Strange Signal Unlike Any Other Pulsar
Medvedev describes the pulsar’s signal as highly unusual. Instead of a continuous spectrum like sunlight, which spreads smoothly across all colors, the Crab Pulsar produces distinct, separated bands.
“There’s a remarkable pattern in Pulsar’s spectrum,” Medvedev said. “Unlike ordinary broad spectra — such as sunlight, which contains a continuous range of colors — the Crab’s high-frequency inter-pulse shows discrete spectral bands. If it were a rainbow, it’s as if only specific ‘colors’ appear, with nothing in between.”
Most pulsars emit radio waves that are noisy and spread out across frequencies. The Crab Pulsar stands apart with sharply defined stripes separated by complete darkness.
“The stripes are absolutely distinct with complete darkness between them,” Medvedev said. “There’s a bright band, then nothing, bright band, nothing. No other pulsar shows this kind of striation. That uniqueness made the Crab Pulsar especially interesting — and challenging — to understand.”
Gravity Provides the Missing Piece
Earlier versions of Medvedev’s model could reproduce the striped pattern, but they failed to match the strong contrast seen in real observations. His research showed that plasma around the pulsar bends and spreads electromagnetic waves through diffraction, helping form the pattern.
Now, by adding Einstein’s theory of gravity into the model, he has accounted for the missing contrast.
“The previous theoretical model could reproduce stripes, but not with the observed contrast. The inclusion of gravity provides the missing piece,” Medvedev said. “The plasma in the pulsar’s magnetosphere can be thought of as a lens — but a defocusing lens. Gravity, by contrast, acts as a focusing lens. Plasma tends to spread light rays apart; gravity pulls them inward. When these two effects are superimposed, there are specific paths where they compensate each other.”
Interference Patterns Produce the Zebra Stripes
The interaction between plasma and gravity creates multiple paths for the pulsar’s radio waves. When these paths align, the waves can either reinforce or cancel each other, forming a pattern of bright and dark bands.
The KU researcher said the combination of a defocusing magnetospheric plasma and a focusing gravity create in-phase and out-of-phase interference bands of radio-wave intensity that appear as the Crab Pulsar’s zebra stripes.
“By symmetry, there are at least two such paths for the light,” he said. “When two nearly identical paths bring light to the observer, they form an interferometer. The signals combine. At some frequencies, they reinforce each other (in phase), producing bright bands. At others, they cancel (out of phase), producing darkness. That is the essence of the interference pattern.”
A New Tool for Studying Neutron Stars
Medvedev believes the core mechanism behind the zebra stripes is now largely understood, though further refinements may improve precision.
“There appears to be little additional physics required to explain the stripes qualitatively,” Medvedev said. “Quantitatively, there may be refinements. For example, the current treatment includes gravity in a static, lowest-order approximation. The pulsar is rotating, and including rotational effects could introduce quantitative changes, though not qualitative ones.”
This new model could give scientists a powerful way to study rotating gravitational systems and better understand pulsars, which are typically difficult to visualize directly. It may also help map how matter is distributed around neutron stars and even offer clues about their internal structure through their gravitational effects.

From low-carb ice cream and keto protein bars to “sugar-free” soda, erythritol has become a staple ingredient in many modern foods.
However, new research from the University of Colorado Boulder suggests this widely used sugar substitute may have serious downsides. Scientists found it can affect brain cells in ways that may increase the risk of stroke.
The findings were published in the Journal of Applied Physiology.
“Our study adds to the evidence suggesting that non-nutritive sweeteners that have generally been purported to be safe, may not come without negative health consequences,” said senior author Christopher DeSouza, professor of integrative physiology and director of the Integrative Vascular Biology Lab.
What Is Erythritol and Why Is It So Popular?
Erythritol was approved by the Food and Drug Administration in 2001. It is a sugar alcohol typically made by fermenting corn and is now used in hundreds of food products. It contains almost no calories, delivers about 80% of the sweetness of regular sugar, and has little effect on insulin levels. Because of this, it is commonly used by people trying to lose weight, manage blood sugar, or reduce carbohydrate intake.
Still, growing research is raising questions about its safety.
A large study of 4,000 people in the U.S. and Europe found that individuals with higher levels of erythritol in their blood were much more likely to experience a heart attack or stroke within three years.
Inside the Study: Effects on Brain Blood Vessels
To better understand why this risk may exist, DeSouza and lead author Auburn Berry, a graduate student in his lab, examined how erythritol affects cells.
In their experiment, researchers exposed human cells that line blood vessels in the brain to an amount of erythritol similar to what is found in a typical sugar-free drink for three hours.
The results showed several concerning changes. The cells produced much less nitric oxide, which helps blood vessels relax and widen, and more endothelin-1, which causes vessels to tighten. When exposed to thrombin, a substance that promotes clotting, the cells had a reduced ability to produce t-PA, a natural compound that helps break down clots. In addition, the treated cells generated higher levels of reactive oxygen species (ROS), also known as “free radicals,” which can damage cells, accelerate aging, and trigger inflammation.
Why These Changes Matter for Stroke Risk
“Big picture, if your vessels are more constricted and your ability to break down blood clots is lowered, your risk of stroke goes up,” said Berry. “Our research demonstrates not only that, but how erythritol has the potential to increase stroke risk.”
DeSouza pointed out that the study used only a single serving amount of erythritol. People who consume multiple servings daily could potentially face greater effects.
What Consumers Should Know
The researchers emphasize that their findings come from lab experiments on cells, not from studies in people, so more research is needed to confirm the risks in real-world settings.
Even so, DeSouza recommends paying closer attention to ingredient labels and watching for erythritol or “sugar alcohol.”
“Given the epidemiological study that inspired our work, and now our cellular findings, we believe it would be prudent for people to monitor their consumption of non-nutrient-sweeteners such as this one,” he said.
Demand for ultrasound has increased but too few people are being trained for the job, sonographers warn.