Faye Woodley says dental care in the UK “feels like we’re going back to Victorian times”.


Faye Woodley says dental care in the UK “feels like we’re going back to Victorian times”.
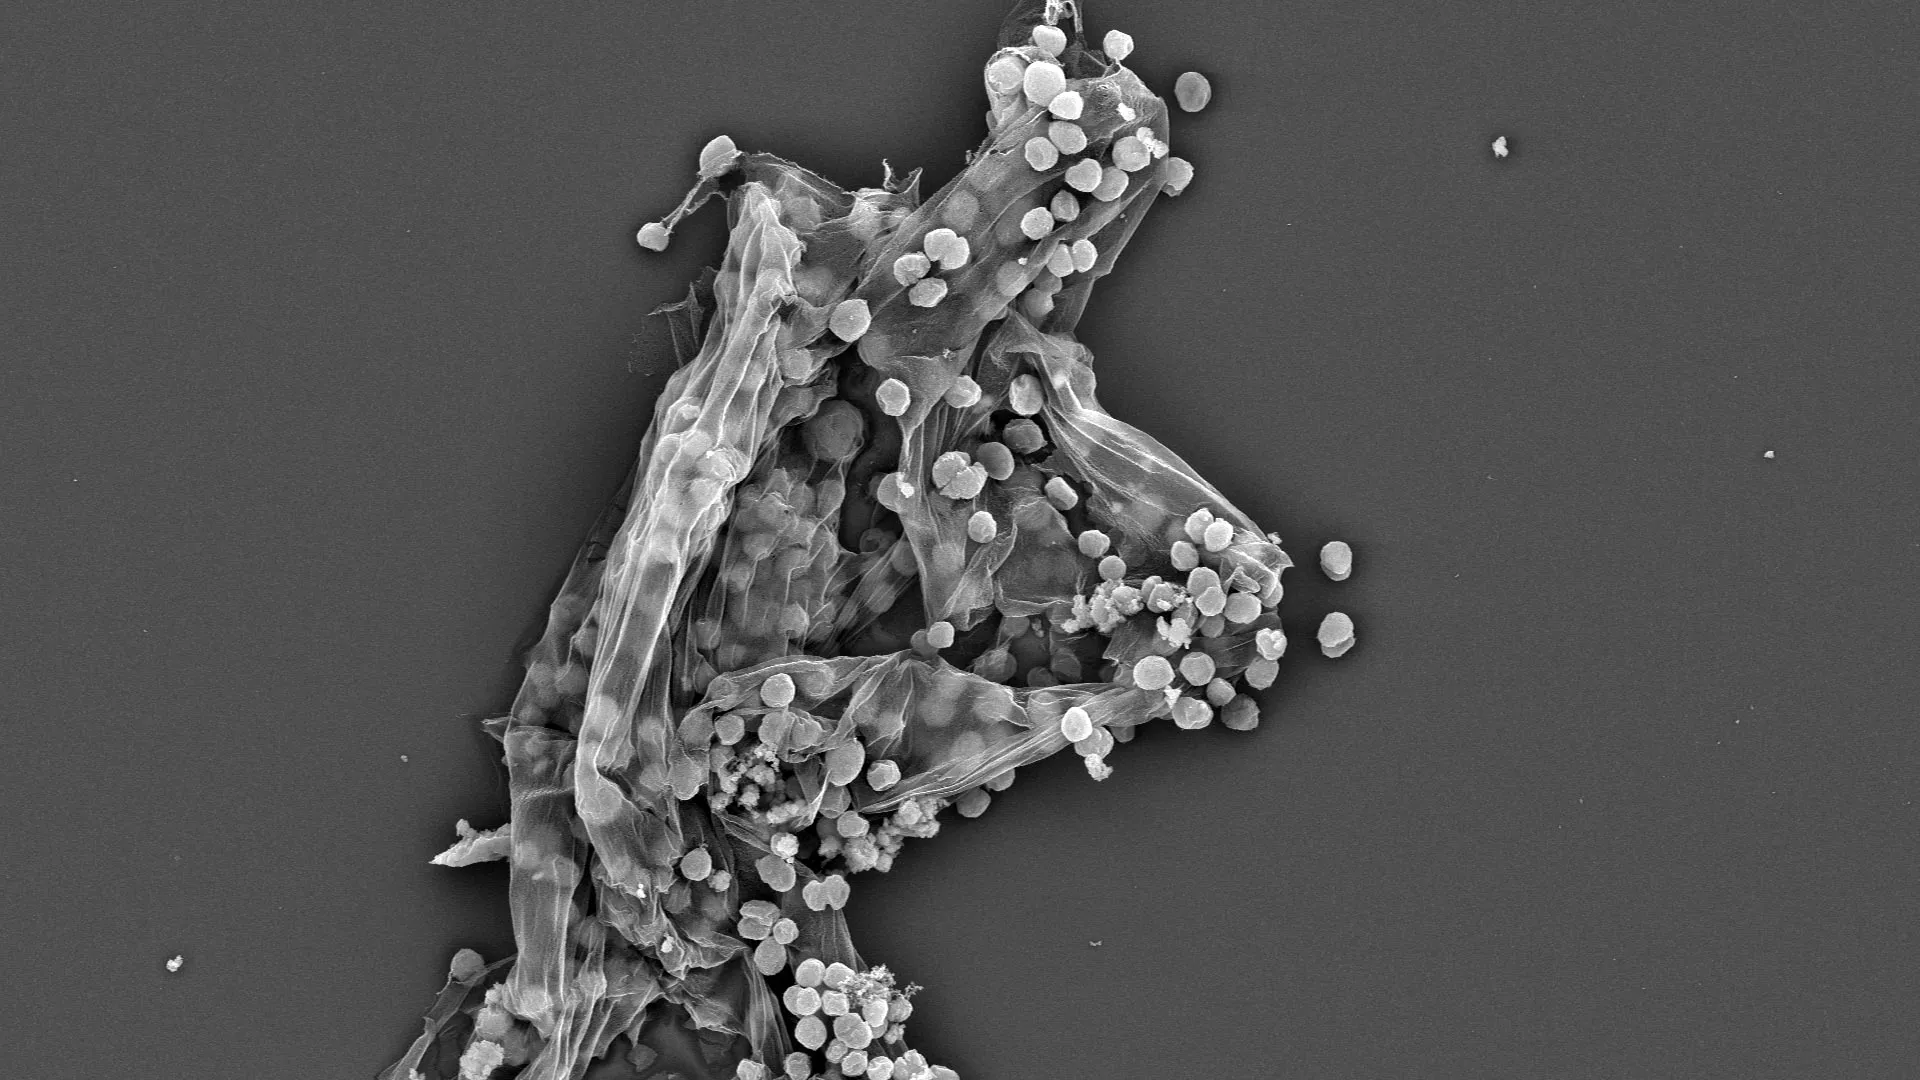
Roughly two-thirds of all emissions of atmospheric methane — a highly potent greenhouse gas that is warming planet Earth — come from microbes that live in oxygen-free environments like wetlands, rice fields, landfills and the guts of cows.
Tracking atmospheric methane to its specific sources and quantifying their importance remains a challenge, however. Scientists are pretty good at tracing the sources of the main greenhouse gas, carbon dioxide, to focus on mitigating these emissions. But to trace methane’s origins, scientists often have to measure the isotopic composition of methane’s component atoms, carbon and hydrogen, to use as a fingerprint of various environmental sources.
A new paper by researchers at the University of California, Berkeley, reveals how the activity of one of the main microbial enzymes involved in producing methane affects this isotope composition. The finding could change how scientists calculate the contributions of different environmental sources to Earth’s total methane budget.
“When we integrate all the sources and sinks of carbon dioxide into the atmosphere, we kind of get the number that we’re expecting from direct measurement in the atmosphere. But for methane, large uncertainties in fluxes exist — within tens of percents for some of the fluxes — that challenge our ability to precisely quantify the relative importance and changes in time of the sources,” said UC Berkeley postdoctoral fellow Jonathan Gropp, who is first author of the paper. “To quantify the actual sources of methane, you need to really understand the isotopic processes that are used to constrain these fluxes.”
Gropp teamed up with a molecular biologist and a geochemist at UC Berkeley to, for the first time, employ CRISPR to manipulate the activity of this key enzyme to reveal how these methanogens interact with their food supply to produce methane.
“It is well understood that methane levels are rising, but there is a lot of disagreement on the underlying cause,” said co-author Dipti Nayak, UC Berkeley assistant professor of molecular and cell biology. “This study is the first time the disciplines of molecular biology and isotope biogeochemistry have been fused to provide better constraints on how the biology of methanogens controls the isotopic composition of methane.”
Many elements have heavier or lighter versions, called isotopes, that are found in small proportions in nature. Humans are about 99% carbon-12 and 1% carbon-13, which is slightly heavier because it has an extra neutron in its nucleus. The hydrogen in water is 99.985% hydrogen-1 and 0.015% deuterium or hydrogen-2, which is twice as heavy because it has a neutron in its nucleus.
The natural abundances of isotopes are reflected in all biologically produced molecules and variations can be used to study and fingerprint various biological metabolisms.
“Over the last 70 years, people have shown that methane produced by different organisms and other processes can have distinctive isotopic fingerprints,” said geochemist and co-author Daniel Stolper, UC Berkeley associate professor of earth and planetary science. “Natural gas from oil deposits often looks one way. Methane made by the methanogens within cow guts looks another way. Methane made in deep sea sediments by microorganisms has a different fingerprint. Methanogens can consume or ‘eat’, if you will, a variety of compounds including methanol, acetate or hydrogen; make methane; and generate energy from the process. Scientists have commonly assumed that the isotopic fingerprint depends on what the organisms are eating, which often varies from environment to environment, creating our ability to link isotopes to methane origins.”
“I think what’s unique about the paper is, we learned that the isotopic composition of microbial methane isn’t just based on what methanogens eat,” Nayak said. “What you ‘eat’ matters, of course, but the amount of these substrates and the environmental conditions matter too, and perhaps more importantly, how microbes react to those changes.”
“Microbes respond to the environment by manipulating their gene expression, and then the isotopic compositions change as well,” Gropp said. “This should cause us to think more carefully when we analyze data from the environment.”
The paper will appear Aug. 14 in the journal Science.
Vinegar- and alcohol-eating microbes
Methanogens — microorganisms that are archaea, which are on an entirely separate branch of the tree of life from bacteria — are essential to ridding the world of dead and decaying matter. They ingest simple molecules — molecular hydrogen, acetate or methanol, for example — excreted by other organisms and produce methane gas as waste. This natural methane can be observed in the pale Will-o’-the-wisps seen around swamps and marshes at night, but it’s also released invisibly in cow burps, bubbles up from rice paddies and natural wetlands and leaks out of landfills. While most of the methane in the natural gas we burn formed in association with hydrocarbon generation, some deposits were originally produced by methanogens eating buried organic matter.
The isotopic fingerprint of methane produced by methanogens growing on different “food” sources has been well established in laboratory studies, but scientists have found that in the complexity of the real world, methanogens don’t always produce methane with the same isotopic fingerprint as seen in the lab. For example, when grown in the lab, species of methanogens that eat acetate (essentially vinegar), methanol (the simplest alcohol), or molecular hydrogen (H2) produce methane, CH4, with a ratio of hydrogen and carbon isotopes different from the ratios observed in the environment.
Gropp had earlier created a computer model of the metabolic network in methanogens to understand better how the isotope composition of methane is determined. When he got a fellowship to come to UC Berkeley, Stolper and Nayak proposed that he experimentally test his model. Stolper’s laboratory specializes in measuring isotope compositions to explore Earth’s history. Nayak studies methanogens and, as a postdoctoral fellow, found a way to use CRISPR gene editing in methanogens. Her group recently altered the expression of the key enzyme in methanogens that produces the methane — methyl-coenzyme M reductase (MCR) — so that its activity can be dialed down. Enzymes are proteins that catalyze chemical reactions.
Experimenting with these CRISPR-edited microbes — in a common methanogen called Methanosarcina acetivorans growing on acetate and methanol — the researchers looked at how the isotopic composition of methane changed when the enzyme activity was reduced, mimicking what is thought to happen when the microbes are starved for their preferred food.
They found that when MCR is at low concentrations, cells respond by altering the activity of many other enzymes in the cell, causing their inputs and outputs to accumulate and the rate of methane generation to slow so much that enzymes begin running both backwards and forwards. In reverse, these other enzymes remove a hydrogen from carbon atoms; running forward, they add a hydrogen. Together with MCR, they ultimately produce methane (CH4). Each forward and reverse cycle requires one of these enzymes to pull a hydrogen off of the carbon and add a new one ultimately sourced from water. As a result, the isotopic composition of methane’s four hydrogen molecules gradually comes to reflect that of the water, and not just their food source, which starts with three hydrogens.
This is different from typical assumptions for growth on acetate and methanol that assume no exchange between hydrogen derived from water and that from the food source.
“This isotope exchange we found changes the fingerprint of methane generated by acetate and methanol consuming methanogens vs. that typically assumed. Given this, it might be that we have underestimated the contribution of the acetate-consuming microbes, and they might be even more dominant than we have thought,” Gropp said. “We’re proposing that we at least should consider the cellular response of methanogens to their environment when studying isotopic composition of methane.”
Beyond this study, the CRISPR technique for tuning production of enzymes in methanogens could be used to manipulate and study isotope effects in other enzyme networks broadly, which could help researchers answer questions about geobiology and the Earth’s environment today and in the past.
“This opens up a pathway where modern molecular biology is married with isotope-geochemistry to answer environmental problems,” Stolper said. “There are an enormous number of isotopic systems associated with biology and biochemistry that are studied in the environment; I hope we can start looking at them in the way molecular biologists now are looking at these problems in people and other organisms — by controlling gene expression and looking at how the stable isotopes respond.”
For Nayak, the experiments are also a big step in discovering how to alter methanogens to derail production of methane and redirect their energy to producing useful products instead of an environmentally destructive gas.
“By reducing the amount of this enzyme that makes methane and by putting in alternate pathways that the cell can use, we can essentially give them another release valve, if you will, to put those electrons, which they were otherwise putting in carbon to make methane, into something else that would be more useful,” she said.
Other co-authors of the paper are Markus Bill of Lawrence Berkeley National Laboratory and former UC Berkeley postdoc Rebekah Stein, and Max Lloyd, who is a professor at Penn State University. Gropp was supported by a fellowship from the European Molecular Biology Organization. Nayak and Stolper were funded, in part, by Alfred B. Sloan Research Fellowships. Nayak also is an investigator with the Chan-Zuckerberg Biohub.
Her story has reignited conversations about the condition that affects about one in ten women.
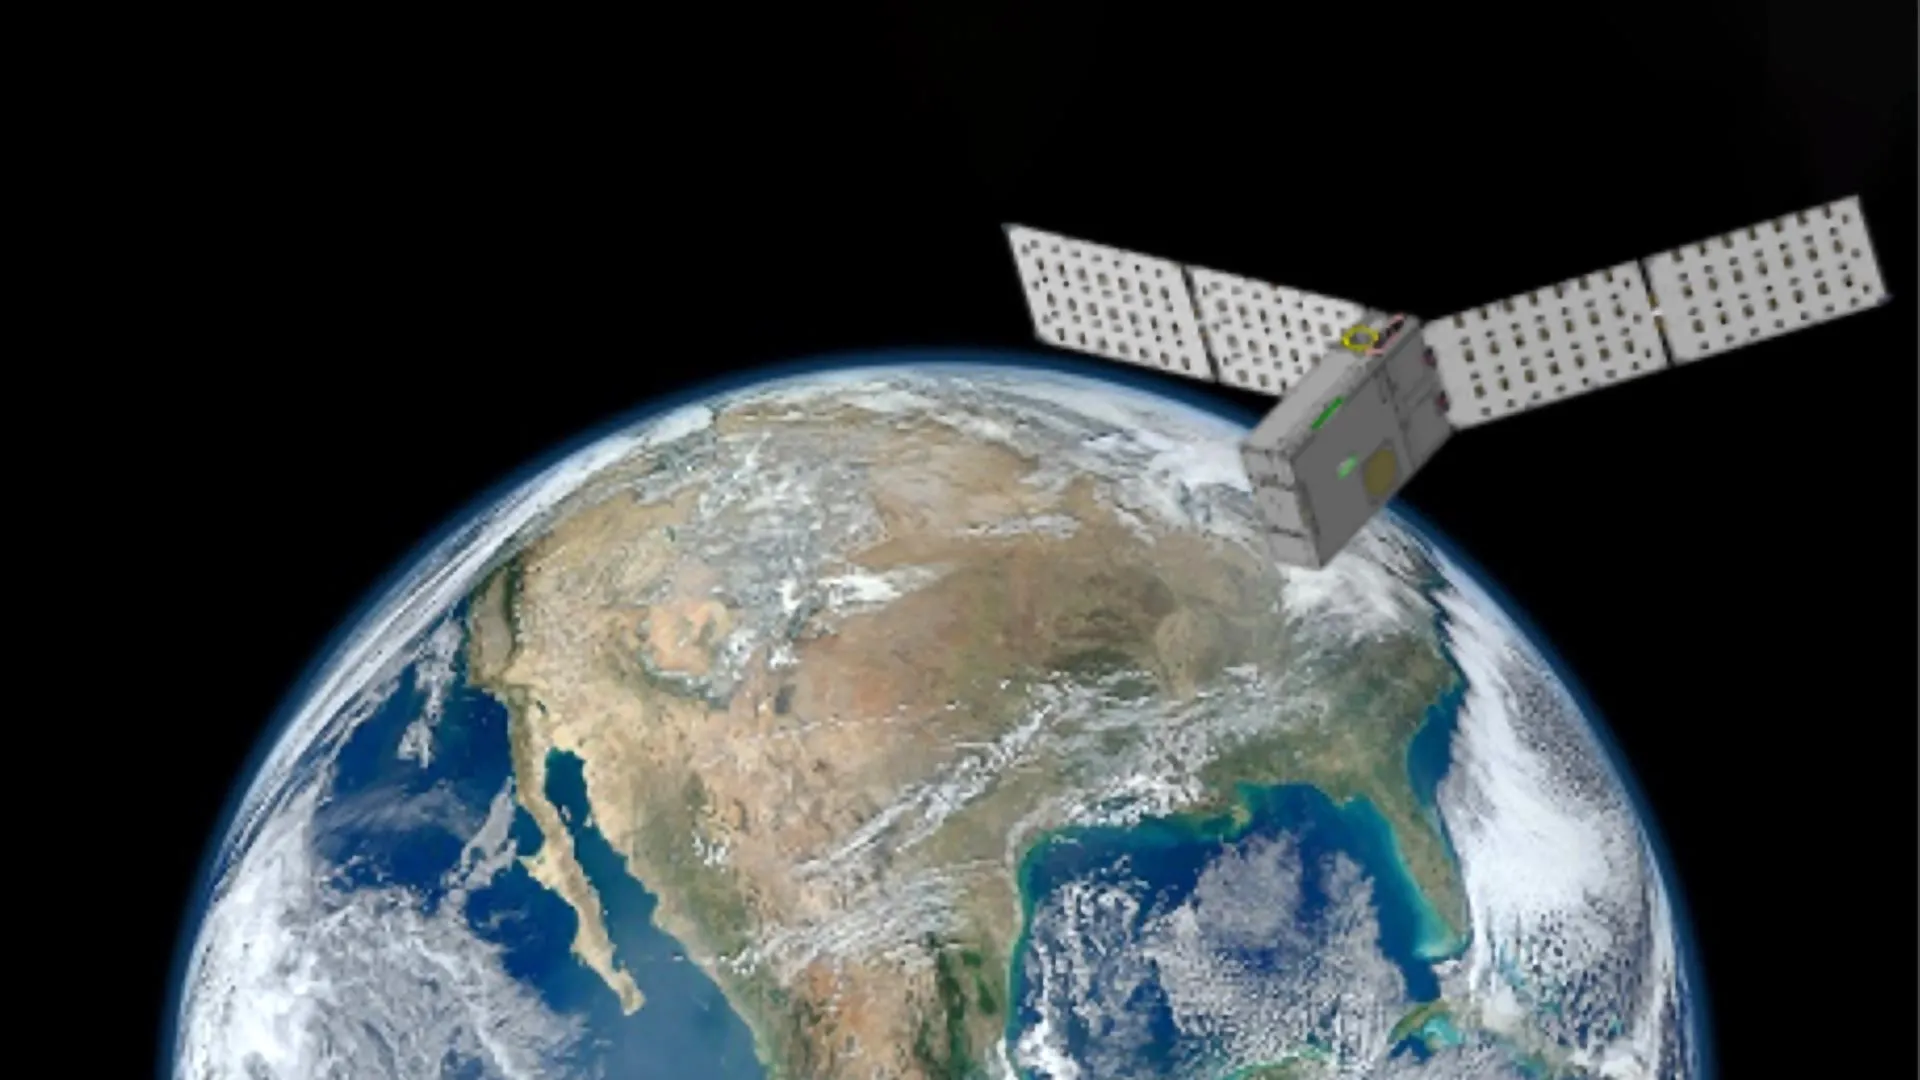
The twin cube satellites will operate through at least September 2026, expanding focus from the poles to the whole planet to improve modelling and weather forecasts.
NASA’s PREFIRE (Polar Radiant Energy in the Far-InfraRed Experiment) mission has been extended through September 2026 and is broadening its focus from Earth’s poles to the entire globe. The mission’s two shoebox-size CubeSats gauge the capacity of water vapor, clouds, and other elements of Earth’s system to trap heat and keep it from radiating into space. This information can help improve forecasts, including weather severity and storm frequency.
Launched in spring 2024, PREFIRE has been measuring how much heat the planet emits into space from the Arctic and Antarctic. Earth absorbs a significant amount of the Sun’s energy in the tropics. Winds, weather, and ocean currents transport that heat toward the poles, which receive much less sunlight. Ice, snow, and clouds, among other parts of the polar environment, emit some of that heat into space, much of it as far-infrared radiation. The difference between the amount of heat Earth absorbs at the tropics and radiates out from the Arctic and Antarctic is a key influence on the planet’s temperature, helping to drive dynamic systems of climate and weather.
At the core of the mission is a pair of advanced spectrometers designed by NASA’s Jet Propulsion Laboratory in Southern California. They measure wavelengths of light in the far-infrared range of the electromagnetic spectrum and are sensitive to 10 times more far-infrared wavelengths than any similar instrument. This information gives researchers insight into processes associated with surface ice melt and formation, snowmelt and accumulation, and changes in cloud cover.
“The PREFIRE satellites show that at these longer wavelengths, the amount of radiation going into space can differ from one type of ice to another by as much as 5%,” said Brian Drouin, PREFIRE’s project scientist at JPL. “Measurements that look at the same areas but with shorter wavelengths do not show this difference.”
Although the PREFIRE CubeSats have been gathering data on the entire globe, the science team has concentrated their analysis on Earth’s polar regions for its prime mission. Going forward, they will expand their work to include data from the rest of the world.
“We have the capacity to collect data for the whole world, not just the poles. What we’ll be able to do is look at the size of ice particles in clouds that affect energy exchange between Earth and space,” said PREFIRE’s principal investigator, Tristan L’Ecuyer of the University of Wisconsin-Madison. “We’ll be able to incorporate the data into weather prediction models to improve forecasts and improve our understanding of how moisture circulates, which affects where storms form and how precipitation moves around the world.”
The satellites are in what’s called an asynchronous near-polar orbit, traveling near the poles with each pass but hours apart from one another. This provides two snapshots of the same area over time, enabling the mission to capture phenomena that occur on short timescales, such as cloud cover’s temporary effects on the temperature of the area beneath it.
More About PREFIRE
NASA’s Jet Propulsion Laboratory manages PREFIRE for the agency’s Science Mission Directorate and provided the spectrometers. Blue Canyon Technologies built the CubeSats and the University of Wisconsin-Madison processes the data the instruments collect. The launch services provider, Rocket Lab USA Inc. of Long Beach, California, launched both PREFIRE CubeSats from Rocket Lab Launch Complex 1 in New Zealand in May and June 2024.

Seventeen days after NISAR’s launch from southeastern India, an essential piece of science hardware has unfurled in orbit.
Spanning 39 feet (12 meters), the drum-shaped antenna reflector on the NISAR (NASA-ISRO Synthetic Aperture Radar) satellite mission from NASA and the Indian Space Research Organisation (ISRO) successfully unfurled in low Earth orbit. The reflector had been stowed, umbrella-like, until the 30-foot (9-meter) boom that supports it could be deployed and locked in place.
Launched by ISRO on July 30 from the Satish Dhawan Space Centre on India’s southeastern coast, NISAR will track the motion of ice sheets and glaciers, the deformation of land due to earthquakes, volcanoes, and landslides, and changes in forest and wetland ecosystems down to fractions of an inch. It also will aid decision-makers in fields as diverse as disaster response, infrastructure monitoring, and agriculture.
“The successful deployment of NISAR’s reflector marks a significant milestone in the capabilities of the satellite,” said Karen St. Germain, director, Earth Science Division at NASA Headquarters in Washington. “From innovative technology to research and modeling to delivering science to help inform decisions, the data NISAR is poised to gather will have a major impact on how global communities and stakeholders improve infrastructure, prepare for and recover from natural disasters, and maintain food security.”
The mission carries the most sophisticated radar systems ever launched as part of a NASA mission. In a first, the satellite combines two synthetic aperture radar (SAR) systems: an L-band system that can see through clouds and forest canopy, and an S-band system that can see through clouds as well but is more sensitive to light vegetation and moisture in snow. The reflector plays a key role for both systems, which is why the successful deployment of the hardware is such a significant milestone.
“This is the largest antenna reflector ever deployed for a NASA mission, and we were of course eager to see the deployment go well. It’s a critical part of the NISAR Earth science mission and has taken years to design, develop, and test to be ready for this big day,” said Phil Barela, NISAR project manager at NASA’s Jet Propulsion Laboratory in Southern California, which managed the U.S. portion of the mission and provided one of the two radar systems aboard NISAR. “Now that we’ve launched, we are focusing on fine-tuning it to begin delivering transformative science by late fall of this year.”
<See link to video at bottom of page.>
How Bloom Works
Weighing about 142 pounds (64 kilograms), the reflector features a cylindrical frame made of 123 composite struts and a gold-plated wire mesh. On Aug. 9, the satellite’s boom, which had been tucked close to its main body, started unfolding one joint at a time until it was fully extended about four days later. The reflector assembly is mounted at the end of the boom.
Then, on Aug. 15, small explosive bolts that held the reflector assembly in place were fired, enabling the antenna to begin a process called the “bloom” — its unfurling by the release of tension stored in its flexible frame while stowed like an umbrella. Subsequent activation of motors and cables then pulled the antenna into its final, locked position.
To image Earth’s surface down to pixels about 30 feet (10 meters) across, the reflector was designed with a diameter about as wide as a school bus is long. Using SAR processing, NISAR’s reflector simulates a traditional radar antenna that for the mission’s L-band instrument would have to be 12 miles (19 kilometers) long to achieve the same resolution.
“Synthetic aperture radar, in principle, works like the lens of a camera, which focuses light to make a sharp image. The size of the lens, called the aperture, determines the sharpness of the image,” said Paul Rosen, NISAR’s project scientist at JPL. “Without SAR, spaceborne radars could generate data, but the resolution would be too rough to be useful. With SAR, NISAR will be able to generate high-resolution imagery. Using special interferometric techniques that compare images over time, NISAR enables researchers and data users to create 3D movies of changes happening on Earth’s surface.”
The NISAR satellite is the culmination of decades of space-based radar development at JPL. Starting in the in the 1970s, JPL managed the first Earth-observing SAR satellite, Seasat, which launched in 1978, as well as Magellan, which used SAR to map the cloud-shrouded surface of Venus in the 1990s.
More About NISAR
The NISAR mission is a partnership between NASA and ISRO spanning years of technical and programmatic collaboration. The successful launch and deployment of NISAR builds upon a strong heritage of cooperation between the United States and India in space. The data produced by NISAR’s two radar systems, one provided by NASA and one by ISRO, will be a testament to what can be achieved when countries unite around a shared vision of innovation and discovery.
The ISRO Space Applications Centre provided the mission’s S-band SAR. The U R Rao Satellite Centre provided the spacecraft bus. Launch services were through Satish Dhawan Space Centre. After launch, key operations, including boom and radar antenna reflector deployment, are being executed and monitored by the ISRO Telemetry, Tracking and Command Network’s global system of ground stations.
Managed by Caltech in Pasadena, JPL leads the U.S. component of the project. In addition to the L-band SAR, reflector, and boom, JPL also provided the high-rate communication subsystem for science data, a solid-state data recorder, and payload data subsystem. NASA’s Goddard Space Flight Center in Greenbelt, Maryland, manages the Near Space Network, which receives NISAR’s L-band data.
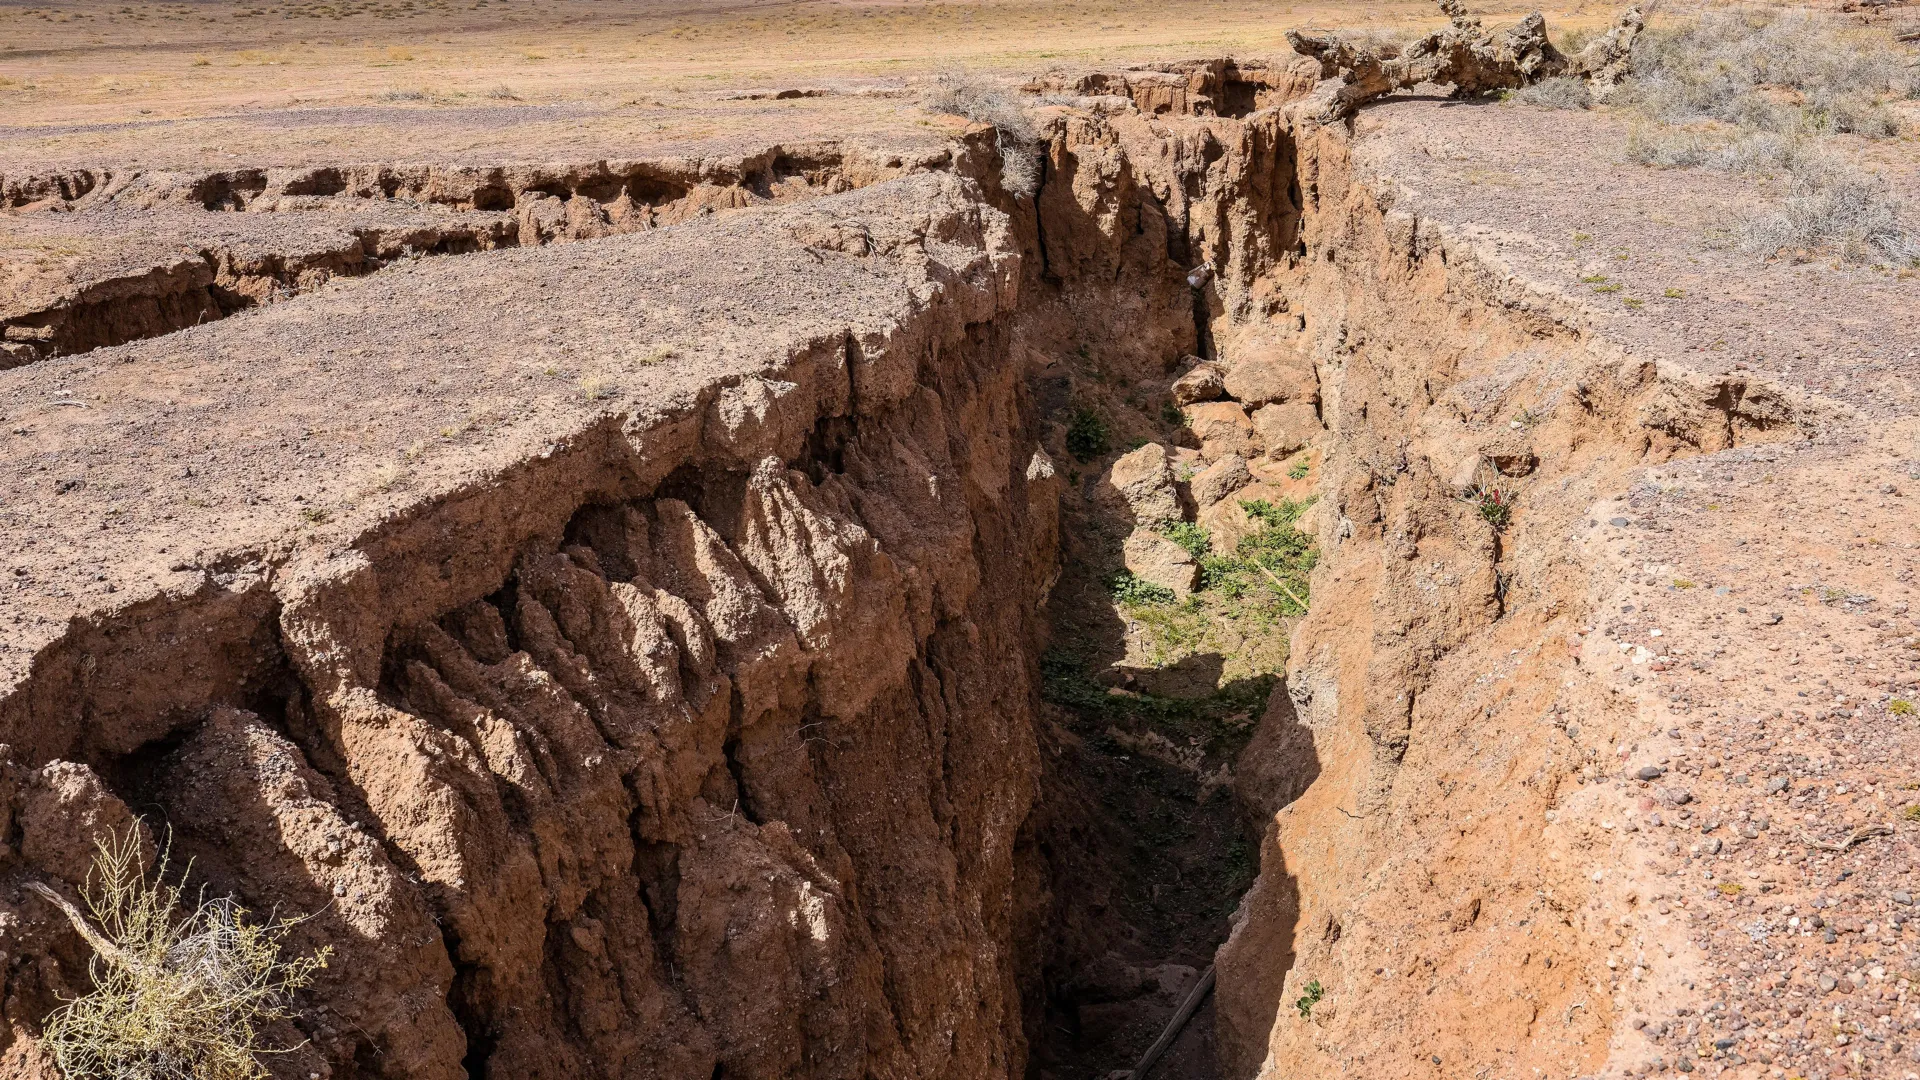
On March 28, 2025, a magnitude 7.7 earthquake struck the Southeast Asia country of Myanmar along the Sagaing Fault, killing thousands and causing widespread damage. A new study from Caltech uses satellite imaging of the Sagaing Fault’s motion to improve models of how such faults may behave in the future. The study indicates that strike-slip faults, like the Sagaing and the San Andreas, may be capable of earthquakes that are significantly different from past known earthquakes and potentially much larger.
The research was conducted primarily in the laboratory of Jean-Philippe Avouac, the Earle C. Anthony Professor of Geology and Mechanical and Civil Engineering and director of the Center for Geomechanics and the Mitigation of Geohazards. Postdoctoral scholar Solène Antoine is the study’s first author. The study is described in a paper appearing in the journal Proceedings of the National Academy of Sciences on August 11.
The Sagaing fault runs in a relatively straight north-to-south line throughout Myanmar. As its two sides slowly move against one another in opposite directions, stress accumulates along the fault. When the stress buildup reaches a breaking point, the fault slips rapidly, causing an earthquake. The Sagaing and San Andreas faults are very similar — both relatively straight strike-slip faults running hundreds of kilometers — and the 2025 Myanmar earthquake, therefore, sheds light on possible future earthquakes on the San Andreas fault.
“This earthquake turned out to be an ideal case to apply image correlation methods [techniques to compare images before and after a geological event] that were developed by our research group,” Antoine says. “They allow us to measure ground displacements at the fault, where the alternative method, radar interferometry, is blind due to phenomenon like decorrelation [a process to decouple signals] and limited sensitivity to north-south displacements.”
Based on studies of historic earthquakes along the Sagaing fault, researchers anticipated that a large earthquake would occur on a 300-kilometer section where no large earthquakes had occurred since 1839. This theory is known as the seismic gap hypothesis: Stuck sections of a fault where there has not been movement are expected to slip to “catch up.” While this section did indeed rupture during the 2025 quake, the fault actually slipped along a total of more than 500 kilometers, indicating that the fault did indeed make up the deficit of slip and more.
In the new study, the team used correlation of satellite optical and radar imagery of the fault — a technique originally developed in the Avouac laboratory and now widely used in seismology — and its surroundings to determine that the 500-kilometer section shifted a net of 3 meters after the quake, that is, the eastern side moved south by 3 meters relative to the western side.
Current models used for seismic hazard assessment are mostly based on earthquake statistics and are time independent, meaning they can only give probabilities of an earthquake during a chosen timespan. For example, these models might estimate, for any given 30-year period and particular area, the probability that an earthquake would exceed a chosen magnitude. However, in order to make truly informed estimates of potential seismic hazards for specific time periods — say, the next 30 years — it is crucial for models to take into account how recently a fault has slipped, where the slip occurred, and by how much.
“The study shows that future earthquakes might not simply repeat past known earthquakes,” Avouac says. “Successive ruptures of a given fault, even as simple as the Sagaing or the San Andreas faults, can be very different and can release even more than the deficit of slip since the last event. In addition, historical records are generally far too short for statistical models to represent the full range of possible earthquakes and eventual patterns in earthquake recurrence. Physics-based models provide an alternative approach with the advantage that they could, in principle, be tuned to observations and used for time-dependent forecast.”
The paper is titled “The 2025 Mw7.7 Mandalay, Myanmar, earthquake reveals complex earthquake cycle with clustering and variable segmentation on Sagaing fault.” In addition to Antoine and Avouac, Caltech co-authors are graduate student Rajani Shrestha, postdoctoral scholar Chris Milliner, and senior research scientist Kyungjae Im. Additional co-authors are Chris Rollins (PhD ’18) of GNS Science Te Pu Ao in New Zealand, Kang Wang of EarthScope Consortium Inc., and Kejie Chen of Southern University of Science and Technology in China. Funding was provided by the Center for Geomechanics and Mitigation of Geohazards, the Statewide California Earthquake Center, the National Science Foundation, and the US Geological Survey.
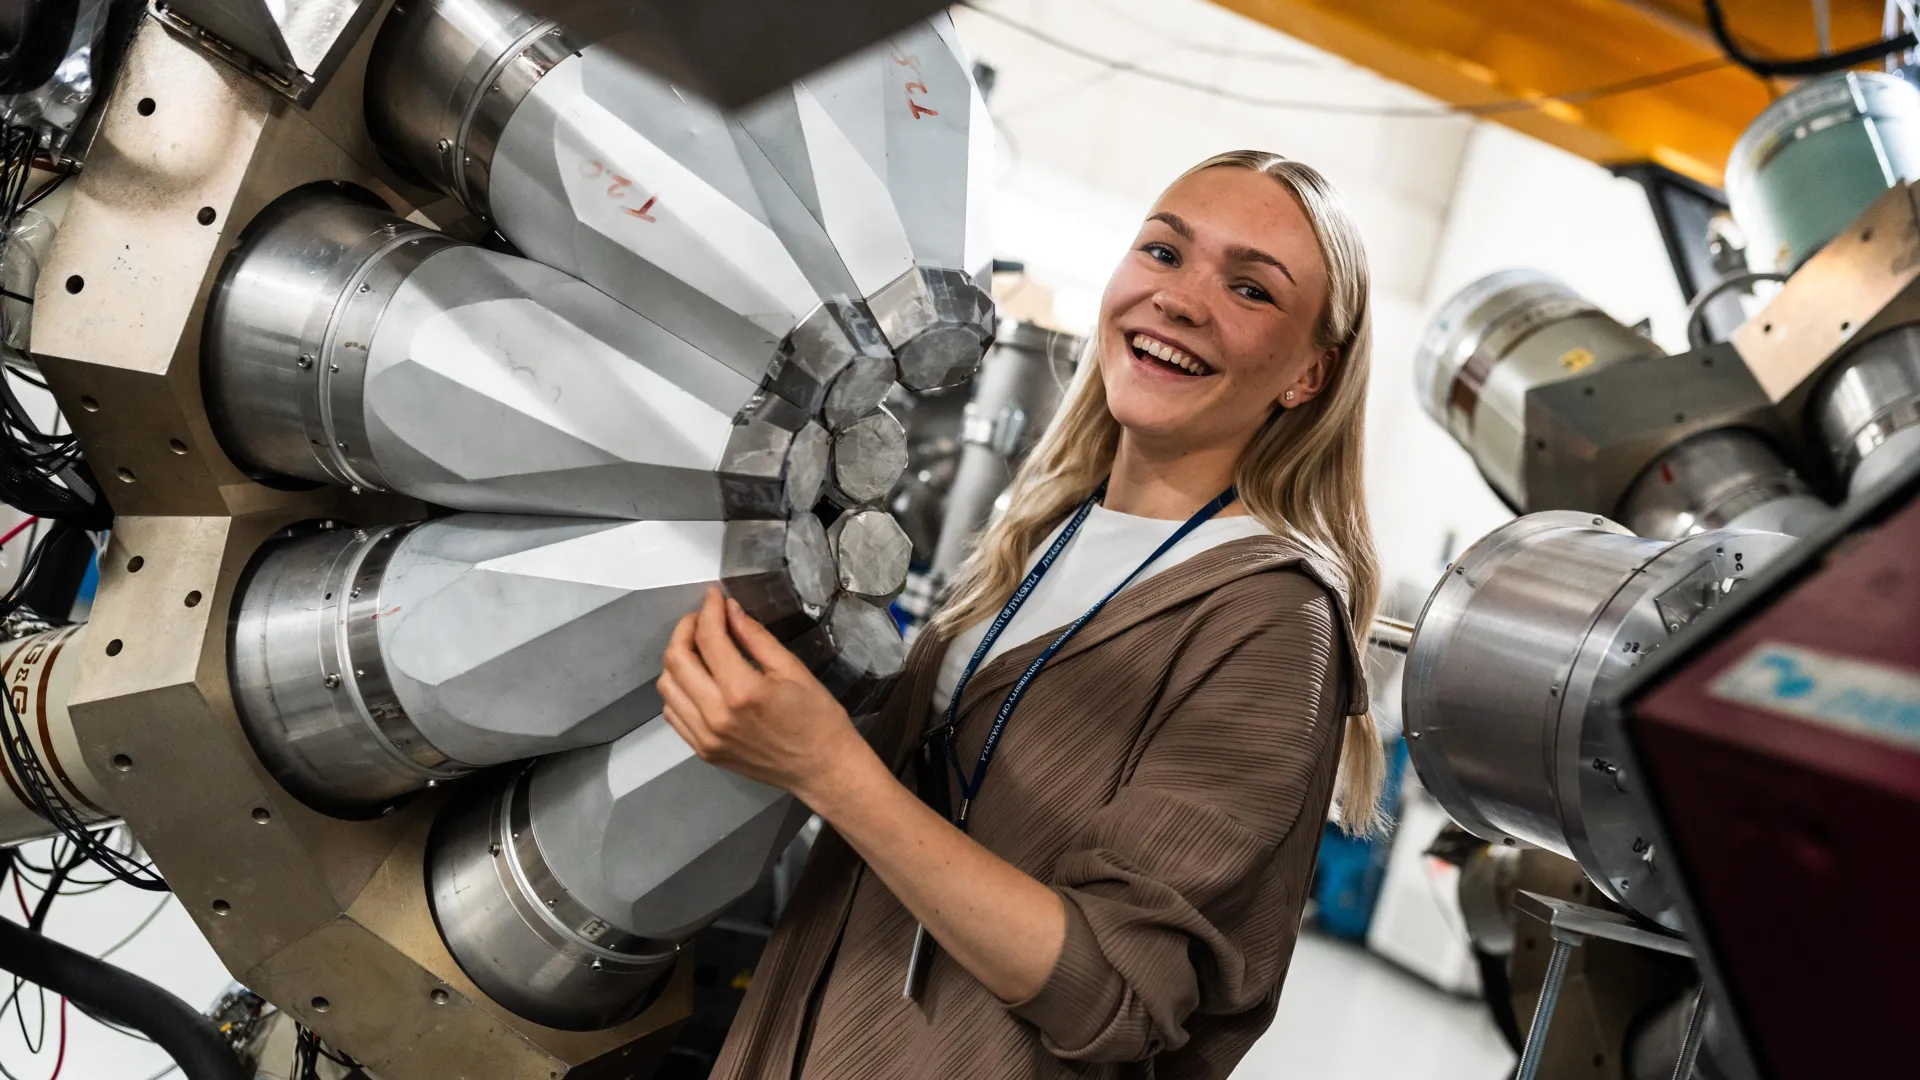
For the first time in more than thirty years, the heaviest nucleus decaying via proton emission has been measured. The previous similar breakthrough was achieved in 1996.
The radioactive decay of atomic nuclei has been one of the keystones of nuclear physics since the beginning of nuclear research. Now the heaviest nucleus decaying via proton emission has been measured in the Accelerator Laboratory of the University of Jyväskylä, Finland.
“Proton emission is a rare form of radioactive decay, in which the nucleus emits a proton to take a step towards stability,” says Doctoral Researcher Henna Kokkonen from the University of Jyväskylä.
Studying exotic nuclei is difficult, but not impossible
The new nucleus is so far the lightest known isotope of astatine, 188At, consisting of 85 protons and 103 neutrons. Exotic nuclei of this kind are extremely challenging to study due to their short lifetimes and low production cross sections, so precise techniques are needed.
“The nucleus was produced in a fusion-evaporation reaction by irradiating natural silver target with 84Sr ion beam,” says Academy Research Fellow Kalle Auranen from the University of Jyväskylä. “The new isotope was identified using the detector setup of the RITU recoil separator.”
Study reveals new findings on heavy nuclei
In addition to the experimental results, the study expanded a theoretical model to interpret the measured data. Through the model, the nucleus can be interpreted as strongly prolate, i.e. “watermelon shaped.”
“The properties of the nucleus suggests a trend change in the binding energy of the valence proton,” says Kokkonen. “This is possibly explained by an interaction unprecedented in heavy nuclei.”
The study is a follow-up to the master’s thesis
The study is part of Kokkonen’s doctoral thesis and a direct scientific follow-up to her master’s thesis, in which she discovered a new type of atomic nucleus, the 190-astatatine. The thesis article was published in the Physical Review C journal in 2023.
“Isotope discoveries are rare worldwide, and this is the second time I have had the opportunity to be part of making history,” Kokkonen rejoices. “Every experiment is challenging, and it feels great to do research that improves understanding of the limits of matter and the structure of atomic nuclei.”
The research article was written as part of an international research collaboration involving experts in theoretical nuclear physics. The study was published in the renowned Nature Communications.
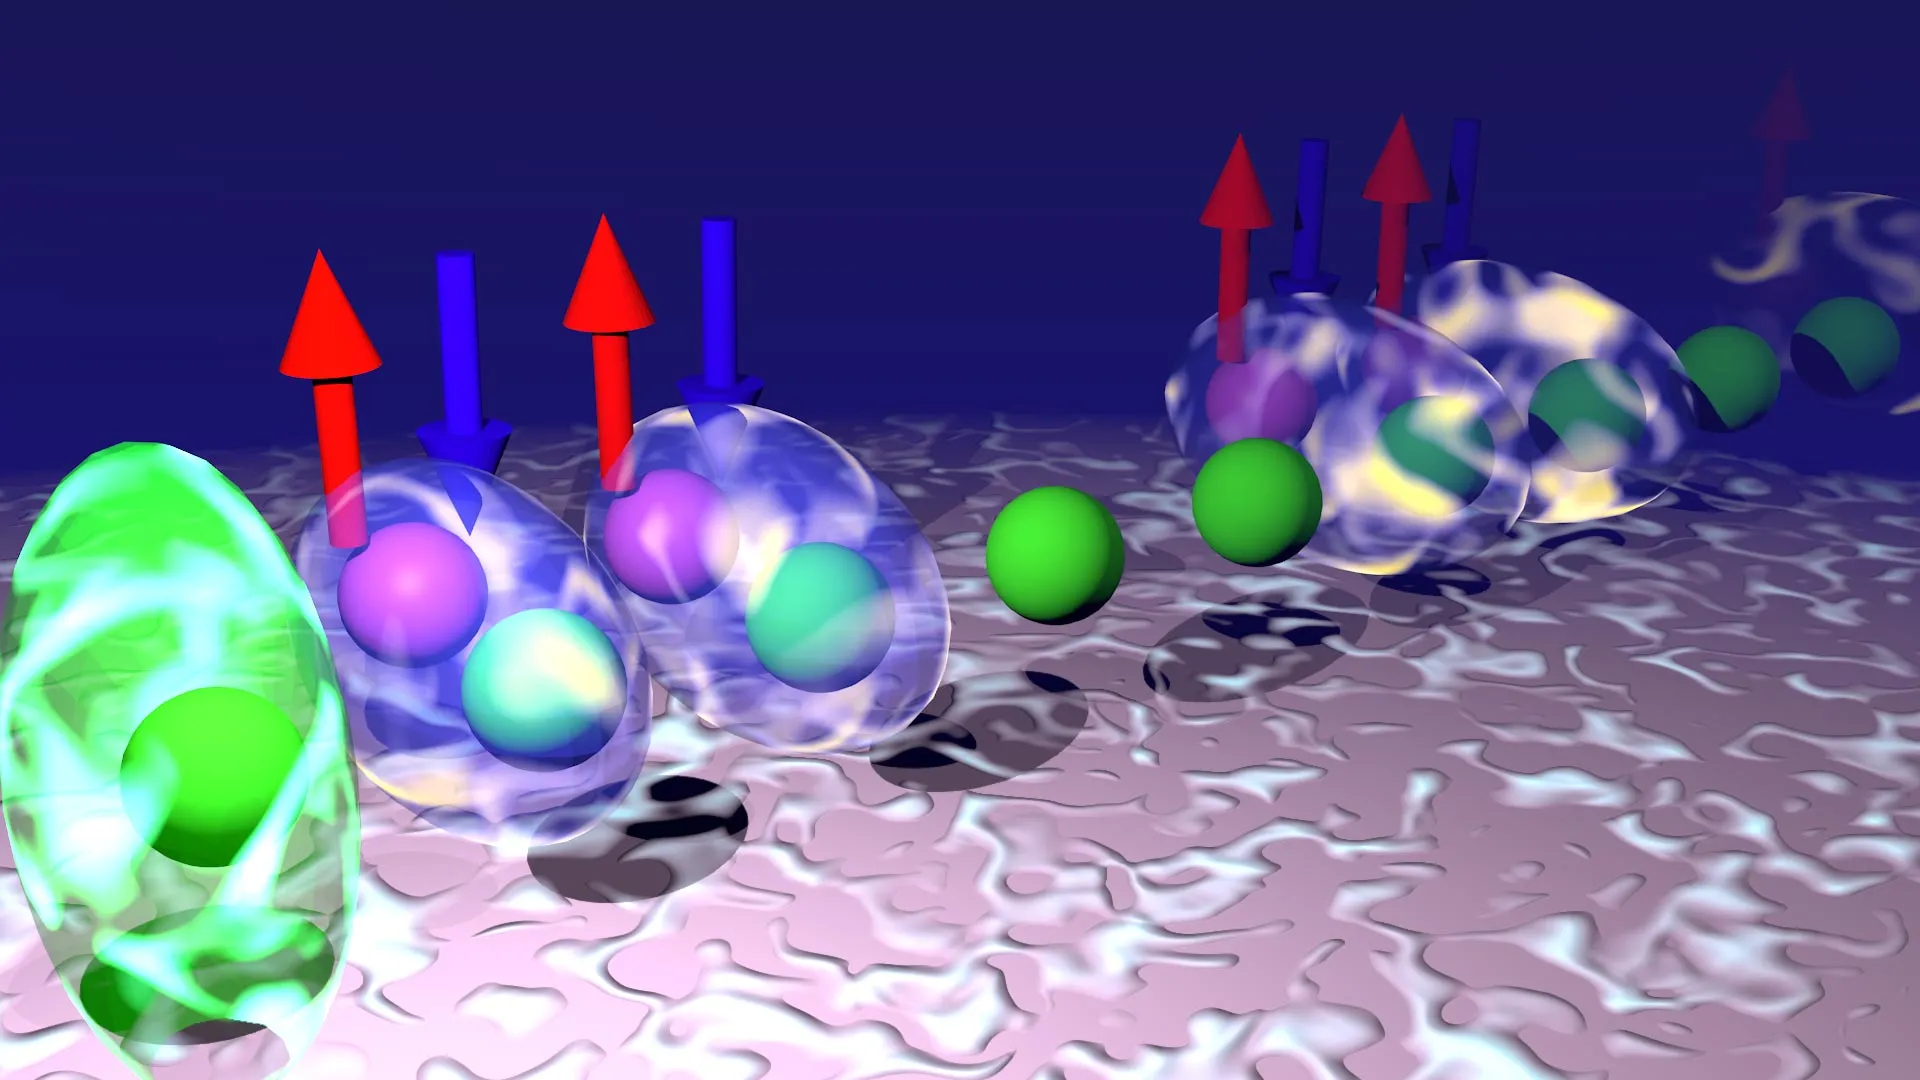
The entry of quantum computers into society is currently hindered by their sensitivity to disturbances in the environment. Researchers from Chalmers University of Technology in Sweden, and Aalto University and the University of Helsinki in Finland, now present a new type of exotic quantum material, and a method that uses magnetism to create stability. This breakthrough can make quantum computers significantly more resilient – paving the way for them to be robust enough to tackle quantum calculations in practice.
At the atomic scale, the laws of physics deviate from those in our ordinary large-scale world. There, particles adhere to the laws of quantum physics, which means they can exist in multiple states simultaneously and influence each other in ways that are not possible within classical physics. These peculiar but powerful phenomena hold the key to quantum computing and quantum computers, which have the potential to solve problems that no conventional supercomputer can handle today.
But before quantum calculations can benefit society in practice, physicists need to solve a major challenge. Qubits, the basic units of a quantum computer, are extremely delicate. The slightest change in temperature, magnetic field, or even microscopic vibrations causes the qubits to lose their quantum states – and thus also their ability to perform complex calculations reliably.
To solve the problem, researchers in recent years have begun exploring the possibility of creating materials that can provide better protection against these types of disturbances and noise in their fundamental structure – their topology. Quantum states that arise and are maintained through the structure of the material used in qubits are called topological excitations and are significantly more stable and resilient than others. However, the challenge remains to find materials that naturally support such robust quantum states.
Newly developed material protects against disturbances
Now, a research team from Chalmers University of Technology, Aalto University, and the University of Helsinki has developed a new quantum material for qubits that exhibits robust topological excitations. The breakthrough is an important step towards realising practical topological quantum computing by constructing stability directly into the material’s design.
“This is a completely new type of exotic quantum material that can maintain its quantum properties when exposed to external disturbances. It can contribute to the development of quantum computers robust enough to tackle quantum calculations in practice,” says Guangze Chen, postdoctoral researcher in applied quantum physics at Chalmers and lead author of the study published in Physical Review Letters.
‘Exotic quantum materials’ is an umbrella term for several novel classes of solids with extreme quantum properties. The search for such materials, with special resilient properties, has been a long-standing challenge.
Magnetism is the key in the new strategy
Traditionally, researchers have followed a well-established ‘recipe’ based on spin-orbit coupling, a quantum interaction that links the electron’s spin to its movement orbit around the atomic nucleus to create topological excitations. However, this ‘ingredient’ is relatively rare, and the method can therefore only be used on a limited number of materials.
In the study, the research team presents a completely new method that uses magnetism – a much more common and accessible ingredient – to achieve the same effect. By harnessing magnetic interactions, the researchers were able to engineer the robust topological excitations required for topological quantum computing.
“The advantage of our method is that magnetism exists naturally in many materials. You can compare it to baking with everyday ingredients rather than using rare spices,” explains Guangze Chen. “This means that we can now search for topological properties in a much broader spectrum of materials, including those that have previously been overlooked.”
Paving the way for next-generation quantum computer platforms
To accelerate the discovery of new materials with useful topological properties, the research team has also developed a new computational tool. The tool can directly calculate how strongly a material exhibits topological behaviour.
“Our hope is that this approach can help guide the discovery of many more exotic materials,” says Guangze Chen. “Ultimately, this can lead to next-generation quantum computer platforms, built on materials that are naturally resistant to the kind of disturbances that plague current systems.”
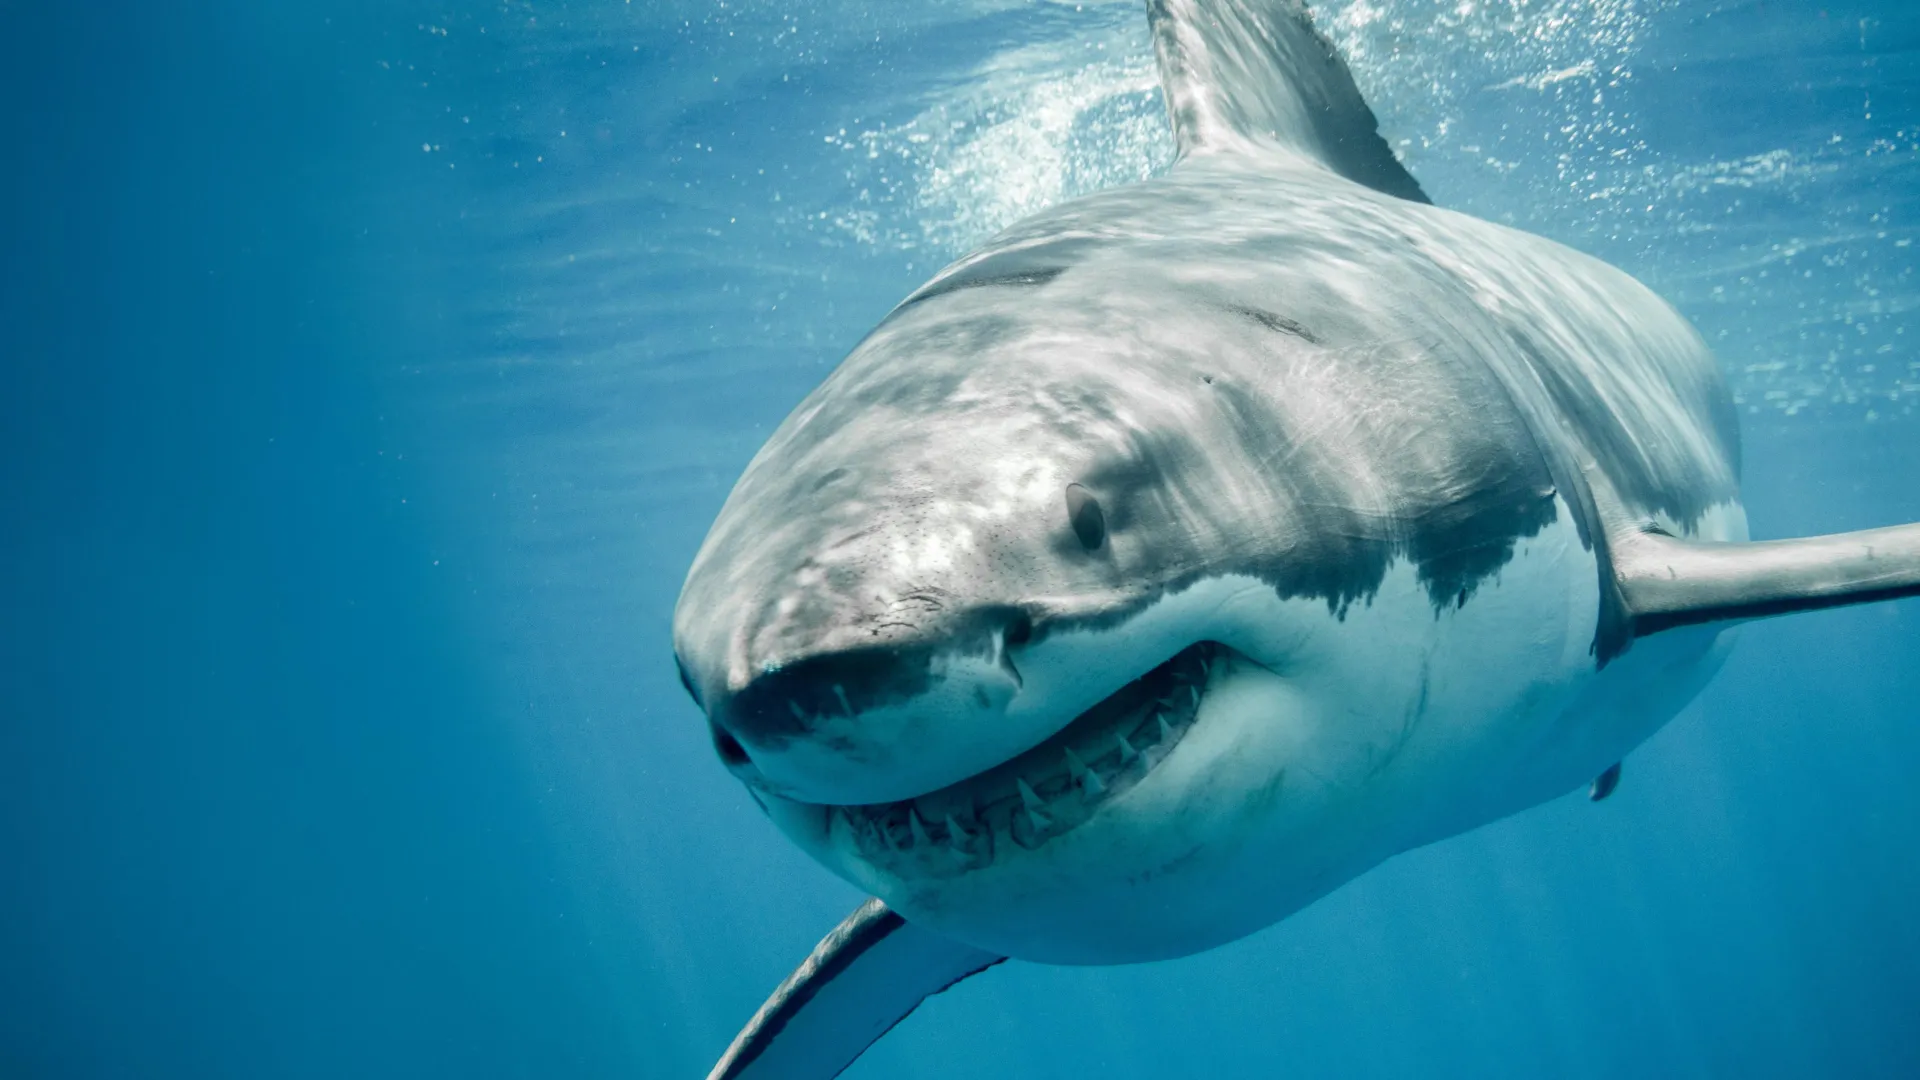
White sharks (Carcharodon carcharias) almost went bottom-up during the last ice age, when sea levels were much lower than they are today and sharks had to get by with less space. The most recent cold snap ended about 10,000 years ago, and the planet has been gradually warming ever since. As temperatures increased, glaciers melted, and sea levels rose, which was good news for great whites.
Results of a study published in the journal Proceedings of the National Academy of Sciences show that white sharks had been reduced to a single, well-mixed population somewhere in the southern Indo-Pacific Ocean. White sharks began genetically diverging about 7,000 years ago, suggesting that they had broken up into two or more isolated populations by this time.
This is new information but not particularly surprising. There are never many white sharks around even at the best of times, as befits their status at the top of the tapered food chain, where a lack of elbow room limits their numbers. Today, there are three genetically distinct white shark populations: one in the southern hemisphere around Australia and South Africa, one in the northern Atlantic and another in the northern Pacific. Though widespread, the number of white sharks still remains low.
“There are probably about 20,000 individuals globally,” said study co-author Gavin Naylor, director of the Florida Program for Shark Research at the Florida Museum of Natural History. “There are more fruit flies in any given city than there are great white sharks in the entire world.”
Organisms with small populations can be pushed dangerously close to the edge of extinction when times are tough. Mile-high glaciers extended from the poles and locked away so much water that by 25,000 years ago, sea levels had plunged by about 40 meters (131 feet), eliminating habitat and restricting great whites to an oceanic corral.
But something happened to great whites during their big comeback that remains as much of a mystery now as it was when it was first discovered more than 20 years ago. The primary motivation for this study was to lay out a definitive explanation, but despite using one of the largest genetic datasets on white sharks ever compiled, things did not go quite according to plan.
“The honest scientific answer is we have no idea,” Naylor said.
Female great white sharks wander off for years to feed but come back home to breed
Scientists first got a whiff of something strange in 2001, when a research team published a paper that opened with the line, “… information about … great white sharks has been difficult to acquire, not least because of the rarity and huge size of this fish.”
The authors of that study compared genetic samples taken from dozens of sharks in Australia, New Zealand and South Africa. They found that though the DNA produced and stored in the nuclei of their cells were mostly the same between individuals, the mitochondrial DNA of sharks from South Africa were distinctly different from those in Australia and New Zealand.
The seemingly obvious explanation was that great whites tend to stick together and rarely make forays into neighboring groups. Over time, unique genetic mutations would have accumulated in each group, which, if it went on long enough, would result in the formation of new species.
This would explain the observed differences in their mitochondrial DNA but not why the nuclear DNA was virtually identical among all three populations. To account for that, the authors suggested that male sharks traveled vast distances throughout the year, but females either never traveled far, or if they did, they most often came back to the same place during the breeding season, a type of migration pattern called philopatry.
This idea was based on the fact that nuclear and mitochondrial DNA are not inherited in equal proportion in plants and animals. The DNA inside nuclei is passed down by both parents to their offspring, but only one — most often the female — contributes mitochondria to the next generation. This is a holdover from the days when mitochondria were free-living bacteria, before they were unceremoniously engulfed and repurposed by the ancestor of eukaryotes.
This was a good guess and had the added benefit of later turning out to be mostly accurate. Male and female great whites do travel large distances in search of food throughout the year, and females consistently make the return journey before it’s time to mate.
Thus, the nuclear DNA of great whites should have less variation, because itinerant males go around mixing things up, while the mitochondrial DNA in different populations should be distinct because philopatric females ensure all the unique differences stay in one place. This has remained the favored explanation for the last two decades, one that seemed to fit like a well-worn glove. Except, no one ever got around to actually putting it on to test its size. This is primarily because the data needed to do so was hard to get for the same reasons mentioned in the touchstone study: There aren’t many great white sharks, and when researchers do manage to find one, taking a DNA sample without losing any appendages in the process can be tricky business.
Shark migration cannot explain nuclear and mitochondrial discordance, so what can?
Naylor and his colleagues began collecting the necessary data back in 2012. “I wanted to get a white shark nuclear genome established to explore its molecular properties,” he said. “White sharks have some very peculiar attributes, and we had about 40 or 50 samples that I thought we could use to design probes to look at their population structure.”
Over the next few years, they also sequenced DNA from about 150 white shark mitochondrial genomes, which are smaller and less expensive to assemble than their nuclear counterparts. The samples came from all over the world, including the Atlantic, Pacific and Indian oceans.
When they compared the two types of DNA, they found the same pattern as the one discovered in 2001. At the population level, white sharks in the North Atlantic rarely mixed with those from the South Atlantic. The same was true of sharks in the Pacific and Indian oceans. At a molecular level, the nuclear DNA among all white sharks remained fairly consistent, while the mitochondrial DNA showed a surprising amount of variation.
The researchers were aware of the philopatric theory and ran a few tests to see if it held up, first by looking specifically at the nuclear DNA. If the act of returning to the same place to mate really were the cause of the strange mitochondrial patterns, some small signal of that should also show up in the nuclear DNA, of which females contribute half to their offspring.
“But that wasn’t reflected in the nuclear data at all,” Naylor said.
Next, they concocted a sophisticated test for the mitochondrial genomes. To do this, they first had to reconstruct the recent evolutionary history of white sharks, which is how they discovered the single southern population they’d been reduced to during the last ice age.
“They were really few and far between when sea levels were lowest. Then the population increased and moved northward as the ice melted. We suspect they remained in those northern waters because they found a reliable food source,” Naylor said. Specifically, they encountered seals, which are a dietary staple among white sharks and one of the main reasons why they have such a strong fidelity to specific locations.
“These white sharks come along, get a nice blubbery sausage. They fatten up, they breed, and then they move off around the ocean.”
Knowing when the sharks split up was key, as each group would have begun genetically diverging from each other at this time. All the researchers had to do was determine whether the 10,000 years between now and the last ice age would have been enough time for the mitochondrial DNA to have accumulated the number of differences observed in the data if philopatry was the primary culprit.
They ran a simulation to find the answer, which came back negative. Philopatry is undoubtedly a behavioral pattern among great whites, but it was not responsible for the large mitochondrial schism.
So Naylor and his colleagues went back to the drawing board to figure out what sort of evolutionary force could account for the differences.
“I came up with the idea that sex ratios might be different — that just a few females were contributing to the populations from one generation to the next,” Naylor said. This type of reproductive skew can be observed in a variety of organisms, including meerkats, cichlid fish and many types of social insects.
But yet another test showed that reproductive skew did not apply to white sharks.
There is a third, albeit less likely, option the team members said they can’t rule out at this stage, namely that natural selection is responsible for the differences. The reason why this is far-fetched has to do with the relative strength of evolutionary forces. Natural selection — the idea that the organisms best suited to leave behind offspring will, in fact, generally be the ones that have the most offspring — is always active, but it has the strongest effect in large populations. Smaller populations, in contrast, are more susceptible to something called genetic drift, in which random traits — even harmful ones — have a much higher chance of being passed down to the next generation.
Florida panthers, for example, are highly endangered, with only a few hundred individuals left in the wild. Most of them have a kink at the end of their tail, likely inherited from a single ancestor. In a large population, subject primarily to natural selection, this trait would have either remained uncommon or disappeared entirely over time. But in a small population, a single cat with a kinked tail can change the world purely by chance through the auspices of genetic drift.
By way of comparison, gravity exerts a force at all scales of matter and energy, but it is by far the weakest of the four fundamental physical forces. At the scale of planets and stars, gravity can hold solar systems and galaxies together, but it has very little influence on the shape or interactions of atoms, which are governed by the three stronger but more localized forces, such as electromagnetism.
According to the study’s results, genetic drift cannot explain the differences between mitochondria in great whites. Because it is a completely random process, it cannot selectively target one type of DNA and spare another. If it were the culprit, similar changes would also be evident in the nuclear DNA.
This leaves natural selection as the only other possibility, which seems unlikely because of the small population sizes among white sharks. If it is the causative agent, Naylor said, the selective force “would have to be brutally lethal.”
If you collect enough mass in a concentrated space, say on the order of a black hole, the otherwise benign force of gravity becomes powerful enough to devour light.
If natural selection is at play in this case, it would manifest itself in a similarly powerful way. Any deviation from the mitochondrial DNA sequence most common in a given population would likely be fatal, thus ensuring it was not passed on to the next generation.
But this is far from certain, and Naylor has his doubts about the validity of such a conclusion. For now, scientists are left with an open-ended question that can only be resolved with further study.
Additional co-authors of the study are: Romuald Laso-Jadart, Elise Gaya, Pierre Lesturgie and Stefano Mona of the Muséum National d’Histoire Naturelle; Shannon L. Corrigan, Lei Yang and Adrian Lee of the Florida Museum of Natural History; Olivier Fedrigo of the The Rockefeller University; Christopher Lowe and Kady Lyons of California State University Long Beach; Greg Skomal of the University of Massachusetts Dartmouth; Geremy Cliff of the University of KwaZulu-Natal; Mauricio Hoyos Padilla of Pelagios-Kakunjá Marine Conservation; Charlie Huveneers of Flinders University; Keiichi Sato of the Okinawa Churaumi Aquarium; and James Glancy of the British Museum of Natural History.
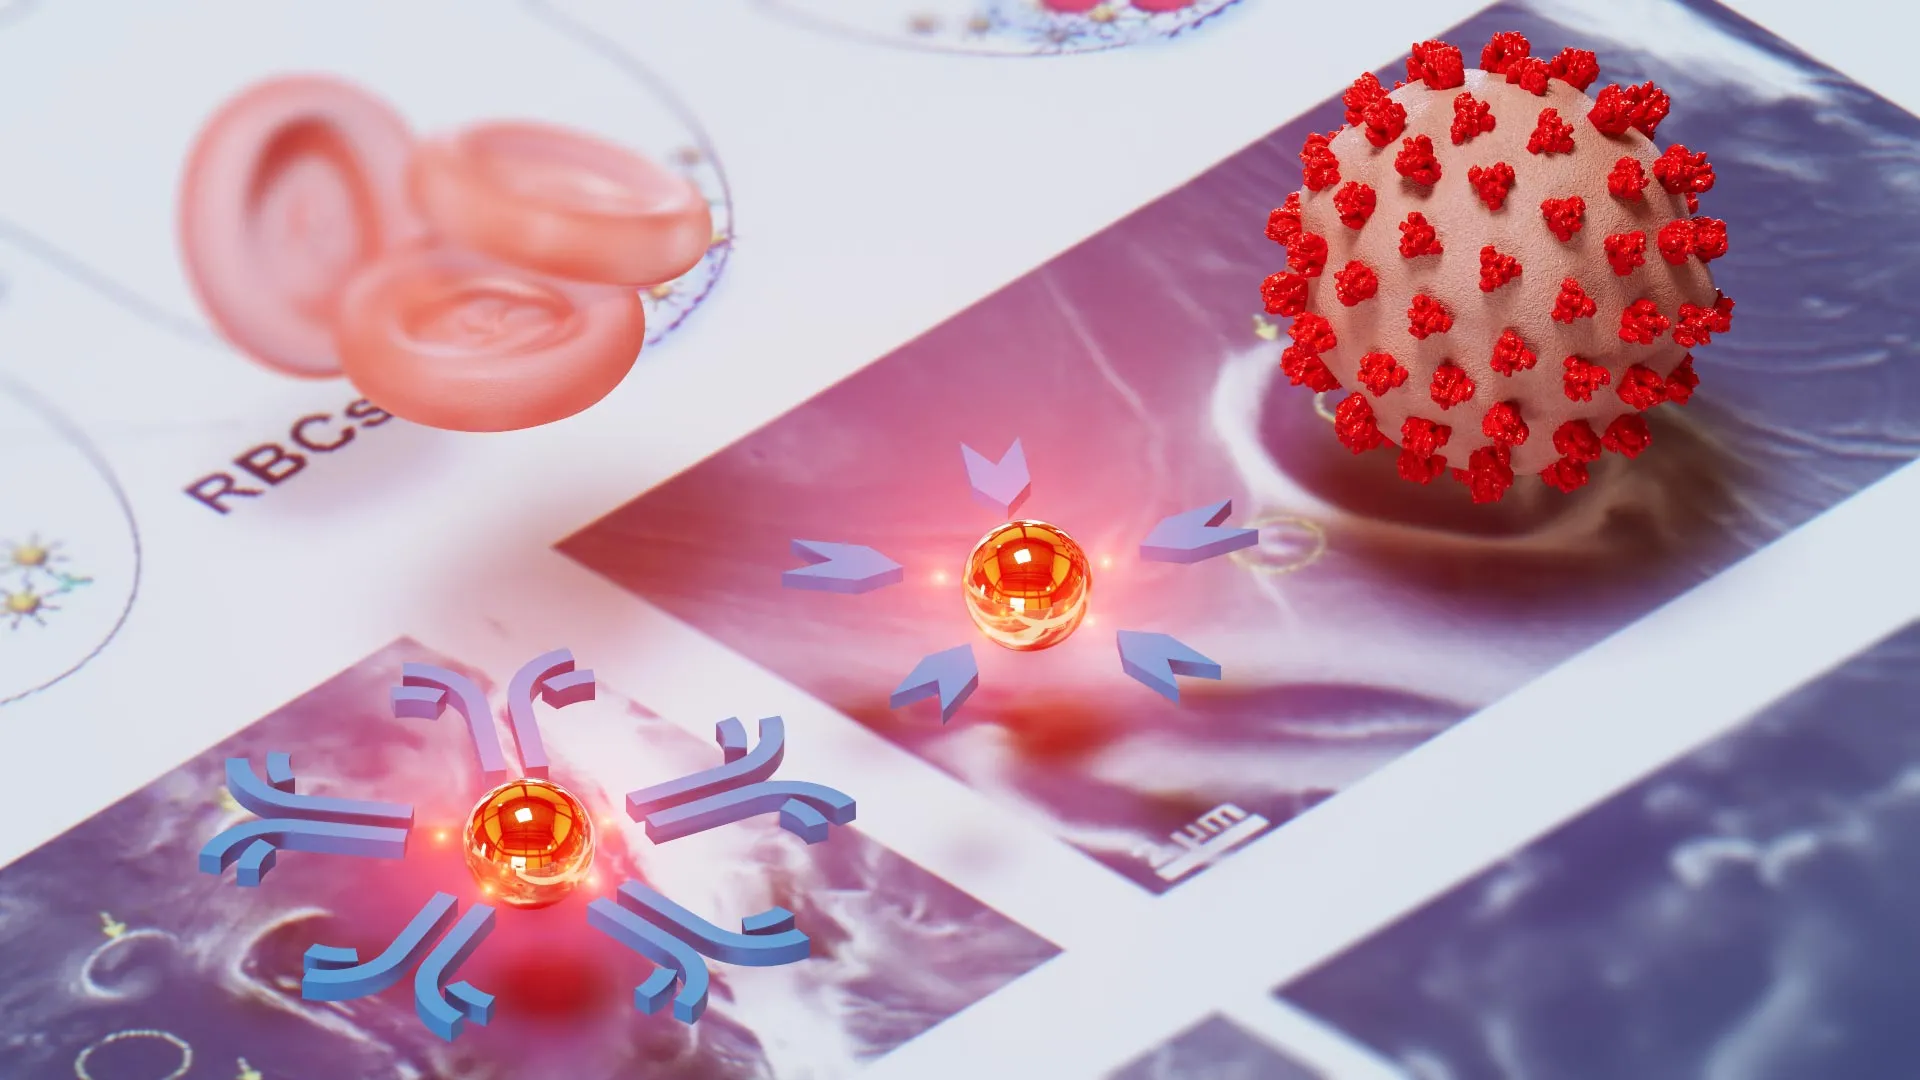
Researchers at Arizona State University have developed a breakthrough diagnostic tool that could transform how quickly and reliably we detect illnesses like COVID-19, Ebola, AIDS or Lyme disease. The test uses just a single drop of blood, costs a couple of dollars and delivers results in only 15 minutes.
In a new study, the researchers show the test can detect the virus that causes COVID-19 with pinpoint accuracy, clearly distinguishing it from other infections.
The new diagnostic device, called NasRED (Nanoparticle-Supported Rapid Electronic Detection), is simple and portable enough to be used almost anywhere — from remote rural clinics to busy urban hospitals. The tool provides lab-quality accuracy without expensive equipment and does not require specialized training, giving it the potential to become a public health game changer.
“We have the speed and ease of use of a rapid antigen test with sensitivity that’s even better than lab-based tests,” says Chao Wang, lead author of the new study. “This is very difficult to achieve.”
Wang is an associate professor with the Biodesign Center for Molecular Design and Biomimetics and ASU’s School of Electrical, Computer and Energy Engineering. He is joined by ASU researchers Yeji Choi, Seyedsina Mirjalili, Ashif Ikbal, Sean McClure, Maziyar Kalateh Mohammadi, Scott Clemens, Jose Solano, John Heggland, Tingting Zhang and Jiawei Zuo.
The research appears in the current issue of the journal ACS Nano.
Halting the spread of infectious diseases
Infectious diseases are one of humanity’s deadliest threats, causing immense suffering and economic damage worldwide. Collectively, infectious diseases cause over 10 million deaths around the world each year, and they are the leading cause of death in low-income countries.
Nearly 800,000 Americans die or are permanently disabled every year due to diagnostic errors, according to a study published in BMJ Quality & Safety. Many of these cases involve infections or vascular events that might have been treatable if caught early.
In many low- and middle-income countries, access to reliable diagnostic testing is limited or nonexistent. Expensive equipment, shortages of trained personnel and long turnaround times all contribute to delayed or missed diagnoses — often with deadly consequences.
A fast, affordable and portable test like NasRED would enable frontline health workers globally to detect infections early and respond before outbreaks spiral out of control.
“In many parts of the world, including the U.S., diseases are spreading, but people often don’t get tested — even for something like HIV. Ideally, you’d want to test them regularly, to catch infections early,” Wang says. “For example, people who use injection drugs are at higher risk for HIV or HCV, but they may be living in the streets and hard to reach. If we don’t test them consistently over time, we may miss the chance to intervene — until they develop serious complications like cancer or liver disease, when it’s much harder to treat.”
Striking diagnostic gold
At the core of the new test are tiny gold nanoparticles, engineered to detect extremely small amounts of disease-related proteins. Researchers coat these nanoparticles with special molecules designed to detect specific diseases.
Some nanoparticles carry antibodies, tiny molecules that act like magnets. Antibodies stick to proteins released by viruses or bacteria when they infect the body. Other nanoparticles carry antigens, fragments of proteins taken directly from viruses or bacteria themselves. These naturally attract antibodies produced by the body to fight infections.
Once coated, these nanoparticles are combined with a tiny sample of bodily fluid, such as a drop of blood, saliva or nasal fluid. If a disease is present, most nanoparticles will sink to the bottom of the tube. If there is no disease, they will remain suspended throughout the liquid.
The NasRED device shines a small beam of LED light through the liquid at the top of the tube. The team built a custom electronic detector that senses how much light gets through the tube. More light means the nanoparticles have sunk to the bottom, leaving the top fluid clearer, meaning that the disease is present.
Accurate, accessible and affordable
The device is so sensitive it can detect disease even when only a few hundred molecules are present in a tiny fluid sample — just a fraction of a single drop. This is a concentration nearly 100,000 times lower than what standard laboratory tests require.
Adding to its promise is NasRED’s portability and affordability. The current gold standards for testing, like PCR or ELISA, require expensive equipment and trained technicians. NasRED is compact and user-friendly. The researchers estimate each test costs $2, making it ideal for use in low-resource or remote locations.
NasRED has the potential to fill a critical diagnostic gap, especially for diseases that are difficult to detect early, such as hepatitis C, HIV or Lyme disease. It is also promising for emerging outbreaks with low prevalence but high risk. Such diseases often go undiagnosed because running a lab test for just one or two patients isn’t cost effective. NasRED bridges that gap by offering a highly sensitive test that works immediately and economically at the point of care.
While NasRED currently requires small, benchtop machines for spinning and mixing samples, the researchers are working to further miniaturize and automate the process. With continued development, the technology might one day become a convenient home test, similar to existing rapid COVID-19 tests. However, it would have vastly superior sensitivity and broader applications.
Significant leap forward in diagnostics
NasRED dramatically surpasses existing diagnostic standards. The new study shows that NasRED is roughly 3,000 times more sensitive than ELISA, requires 16 times less sample volume, and delivers results approximately 30 times faster.
An earlier version of the technology detected Ebola in a tiny sample of blood. “For the new technology, we pushed the sensitivity down to the attomolar range,” Wang says. That’s like detecting a single drop of ink in 20 Olympic swimming pools.
The technology holds promise for detecting viral loads directly from bodily fluids without the complicated sample preparation used in PCR-based methods. In preliminary tests with actual coronavirus particles, NasRED achieved sensitivities comparable to Abbott ID NOW, a popular molecular test for many diseases such as COVID-19.
“One of the strengths of our sensor is that it’s highly modular,” Wang says. “The nanoparticles are designed so that we can easily swap in different proteins, allowing the same platform to be adapted for many different diseases. We’ve already demonstrated this approach in our research on Shiga toxin-producing E. coli, as well as cancer biomarkers, Alzheimer’s-related proteins, Lyme disease and African swine fever.”
Wang recently received the Bay Area Lyme Foundation Emerging Leader Award and will make use of the high sensitivity and portability of this new technology to detect early Lyme infection.
As the technology evolves, its range of applications may extend beyond infectious diseases. Early detection of cancers, real-time monitoring of chronic illnesses and improved surveillance of public health threats are all within reach.
