Plants’ secret second roots rewrite the climate playbook

Plants and trees extend their roots into the earth in order to draw nutrients and water from the soil — however, these roots are thought to decline as they move deeper underground. But a new study by a multi-institutional team of scientists shows that many plants develop a second, deeper layer of roots — often more than three feet underground — to access additional nourishment.

Published in the journal Nature Communications, the study reveals previously unrecognized rooting patterns, altering our understanding of how ecosystems

respond to changing environmental conditions. More importantly, the study suggests that plants might transport and store fixed carbon deeper than currently thought — welcome news at a time when CO2 levels are at an 800,000-year high, according to the World Meteorological Organization’s “State of the Global Climate Report” issued in March.

“Understanding where plants grow roots is vital, as deeper roots could mean safer and longer-term carbon storage. Harsher conditions at depth may prevent detritus-feeding microbes from releasing carbon back to the atmosphere,” says Mingzhen Lu, an assistant professor at New York University’s Department of Environmental Studies and the paper’s lead author. “Our current ecological observations and models typically stop at shallow depths; by not looking deep enough, we may have overlooked a natural carbon storage mechanism deep underground.”

The research team used data from the National Ecological Observatory Network (NEON) to examine rooting depth. The NEON database includes samples collected from soil 6.5 feet below the surface, far deeper than the one-foot depth of traditional ecological studies. This unprecedented depth allowed researchers to detect additional root patterns, spanning diverse climate zones and ecosystem types from the Alaskan tundra to Puerto Rico’s rainforests.

The scientists’ work focused on three questions — all with the aim of better understanding plants’ resource acquisition strategies and their resilience in response to environmental change:

  • How does the abundance of roots change with depth?
  • What are the factors that impact the distribution of roots with depth?
  • Are nutrients in deeper soils equally, under-, or over-exploited by fine roots compared with surface soil?

The researchers found that nearly 20 percent of the studied ecosystems had roots that peaked twice across depth — a phenomenon called “bimodality.” In these cases, plants developed a second, deeper layer of roots, often more than three feet underground and aligning with nutrient-rich soil layers.This suggests that plants grew — in previously unknown ways — to exploit additional sustenance.

“The current understanding of roots is literally too shallow. Above ground, we have eagle vision — thanks to satellites and remote sensing. But below ground, we have mole vision,” observes Lu, former Omidyar Fellow who conducted part of this research at the Sante Fe Institute and as a postdoctoral affiliate at Stanford University. “Our limited below ground vision means that we cannot estimate the full ability of plants to store carbon deep in the soil.”

“Deep plant roots may cause increased soil carbon storage in one condition or lead to losses in other conditions due to a stimulation of soil microbes,” suggests coauthor Avni Malhotra, the lead author of a companion study that investigated the connection between root distribution and soil carbon stock. “This discovery opens a new avenue of inquiry into how bimodal rooting patterns impact the dynamics of nutrient flow, water cycling, and the long-term capacity of soils to store carbon.”

“Scientists and policymakers need to look deeper beneath the Earth’s surface as these overlooked deep soil layers may hold critical keys for understanding and managing ecosystems in a rapidly changing climate,” concludes Lu. “The good news is plants may already be naturally mitigating climate change more actively than we’ve realized — we just need to dig deeper to fully understand their potential.”

The study also included researchers from Boston College, Columbia University, Dartmouth College, the Morton Arboretum, the National Ecological Observatory Network-Battelle, Pacific Northwest National Laboratory, and Stanford University.

Share Button

Why today’s assisted dying vote is so significant

The debate around assisted dying has been a polarised one – and there are still hurdles to cross before it will be a reality here.

Share Button

Hidden carbon giants: Satellite data reveals a 40-year Arctic peatland surge

Peatlands across the Arctic are expanding as the climate warms, new research shows.

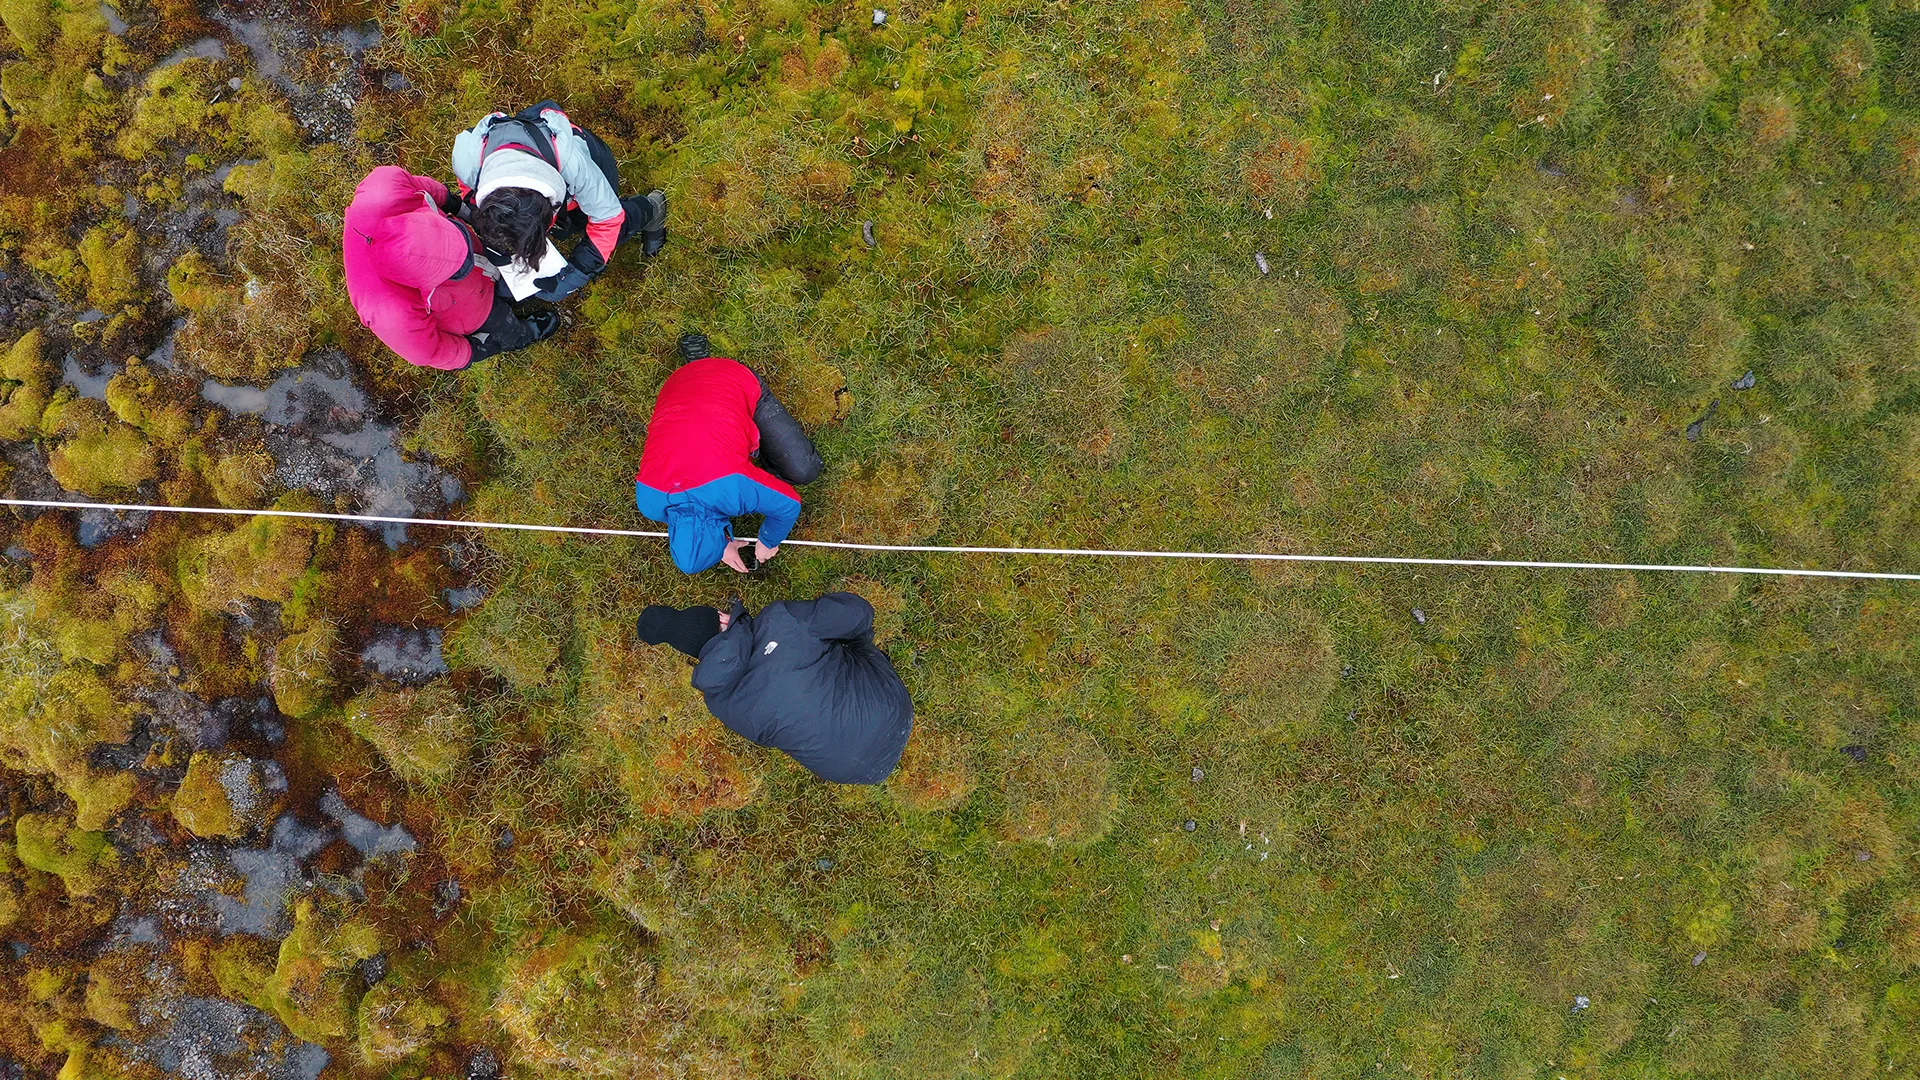
Scientists used satellite data, drones and on-the-ground observations to assess the edges of existing peatlands (waterlogged ecosystems that store vast amounts of carbon).

The study – led by the University of Exeter – found peatlands in the European and Canadian Arctic have expanded outwards in the last 40 years.

While this could slow climate change by storing carbon, the researchers warn that extreme future warming could cause widespread loss of peatlands – releasing that carbon and further accelerating the climate crisis.

“The Arctic has warmed faster than the rest of the planet, with average temperatures increasing by about 4°C in the last four decades,” said Dr Katherine Crichton.

“This has improved growing conditions for plants, causing ‘greening’ of the Arctic. We wanted to identify if this greening could be from peatland plant communities.

“We know from paleo records that warmer periods in Earth’s history led to more carbon being stored in peatlands.

“Our new study puts these pieces together to examine whether our warming climate is causing peatland expansion – and we find strong evidence that it is.”

Peatlands cover just 3% of Earth’s surface but they store about 600 billion tons of carbon – more than all the world’s forest biomass combined.

The Arctic has large peatland areas but these peter out in the far north, where harsh conditions limit plant growth.

In the new study, researchers examined 16 sites – a range of peatlands in both the low and high Arctic – and compared data from 1985-95 with the last 15-20 years.

They found strong evidence of expansion at more than two thirds of sites (measured by “peak-summer greening” – increased growth of peatland-forming plants at the edges of existing peatlands).

The largest changes were found in places with the highest increases in summer temperature, such as the Norwegian islands of Svalbard.

“Our findings suggest Arctic peatlands are an increasingly important natural carbon sink, at least in the near term,” said Professor Karen Anderson, from the Environment and Sustainability Institute on Exeter’s Penryn Campus in Cornwall.

“But if temperatures continue to rise, we are likely to see changes in rainfall, and we are not sure how sustainable new or existing peatlands will be. Plus we could see increases of methane emissions at the same time.

“So – while our study gives us some positive news – it does not detract from the urgent need to reduce greenhouse gas emissions and stabilize our climate.”

The story behind the study

This study took researchers on an unexpected journey that included COVID lockdowns, polar bear safety training and dragging a canoe overland.

Like many research projects, it started with pilot studies – one extracting and analyzing peatland samples in Canada and Finland, the other testing “remote sensing” with drones and satellites.

The team wanted to combine these to find out how climate change is affecting Arctic peatlands. They started applying for funding in 2013, and got their first rejection in 2015. Two more rejections came the following year. In 2018, they finally got a grant – and the project started in summer 2019.

Dr Crichton used Google Earth Engine to identify possible study sites, and Professor Angela Gallego-Sala went on the first fieldwork expedition – to Svalbard, where she received training on avoiding encounters with hungry polar bears.

With the research finally making progress, COVID lockdowns halted fieldwork and lab work. While this hampered the project, Dr Crichton’s computer-based work could continue. “I was still at my desk using Google Earth Engine,” she said. “Lockdown didn’t make any difference to the work I was doing.”

So Dr Crichton continued identifying fieldwork sites, analyzing data and applying for permits – paving the way for fieldwork in Canada in 2021-22. On one of those expeditions, Professor Gallego-Sala stayed at a basic research station on Bylot Island where the washing facility was a “half-frozen lake.” She said: “It was light all the time. You could do fieldwork all day long and all night if you wanted to.”

From that research station, the team visited remote sites via helicopter. Many sites had no name, and the pilot wanted names in order to arrange pick-ups – so sites got informal names including “Glacial Nirvana” and “Angela’s Paradise.” At each site, the team extracted peatland cores to learn about the history of the peatland and how it might be changing.

At Salluit in northern Canada, the team had an Inuit guide for expeditions out into the peatland – during which they saw wildlife including black bears and reindeer, and caught fish and mussels for dinner each evening. When the team laid out their plan one day, the guide shrugged and said: “You can go wherever you want.” He did not mention that their plan would leave their canoe stuck on a large area of sand at low tide.

The three female researchers had to push the stranded boat overland, while the guide sat in it. “We pushed it a long way through the sand,” Professor Gallego-Sala said. “It was pretty tough – but it was also hilarious, and we managed to get it out.”

“Meanwhile, I’m still sat at my computer by the way,” said Dr Crichton, laughing. But this work provided a crucial component – allowing comparison between peatland cores and long-term satellite data that shows peatland edges getting greener as vegetation spreads.

Professor Gallego-Sala added: “Going out for fieldwork is a short time in comparison to the rest of the work. There is lots of lab work to analyse the samples, then extensive data analysis before the findings can be written into a published paper.”

The study is part of a project called Increased Accumulation in Arctic Peatlands (ICAAP), funded by the Natural Environment Research Council.

The paper, published in the journal Communications Earth and Environment, is entitled: “Satellite data indicates recent Arctic peatland expansion with warming.”

Share Button

Flash floods in the Alps: How climate change is supercharging summer storms

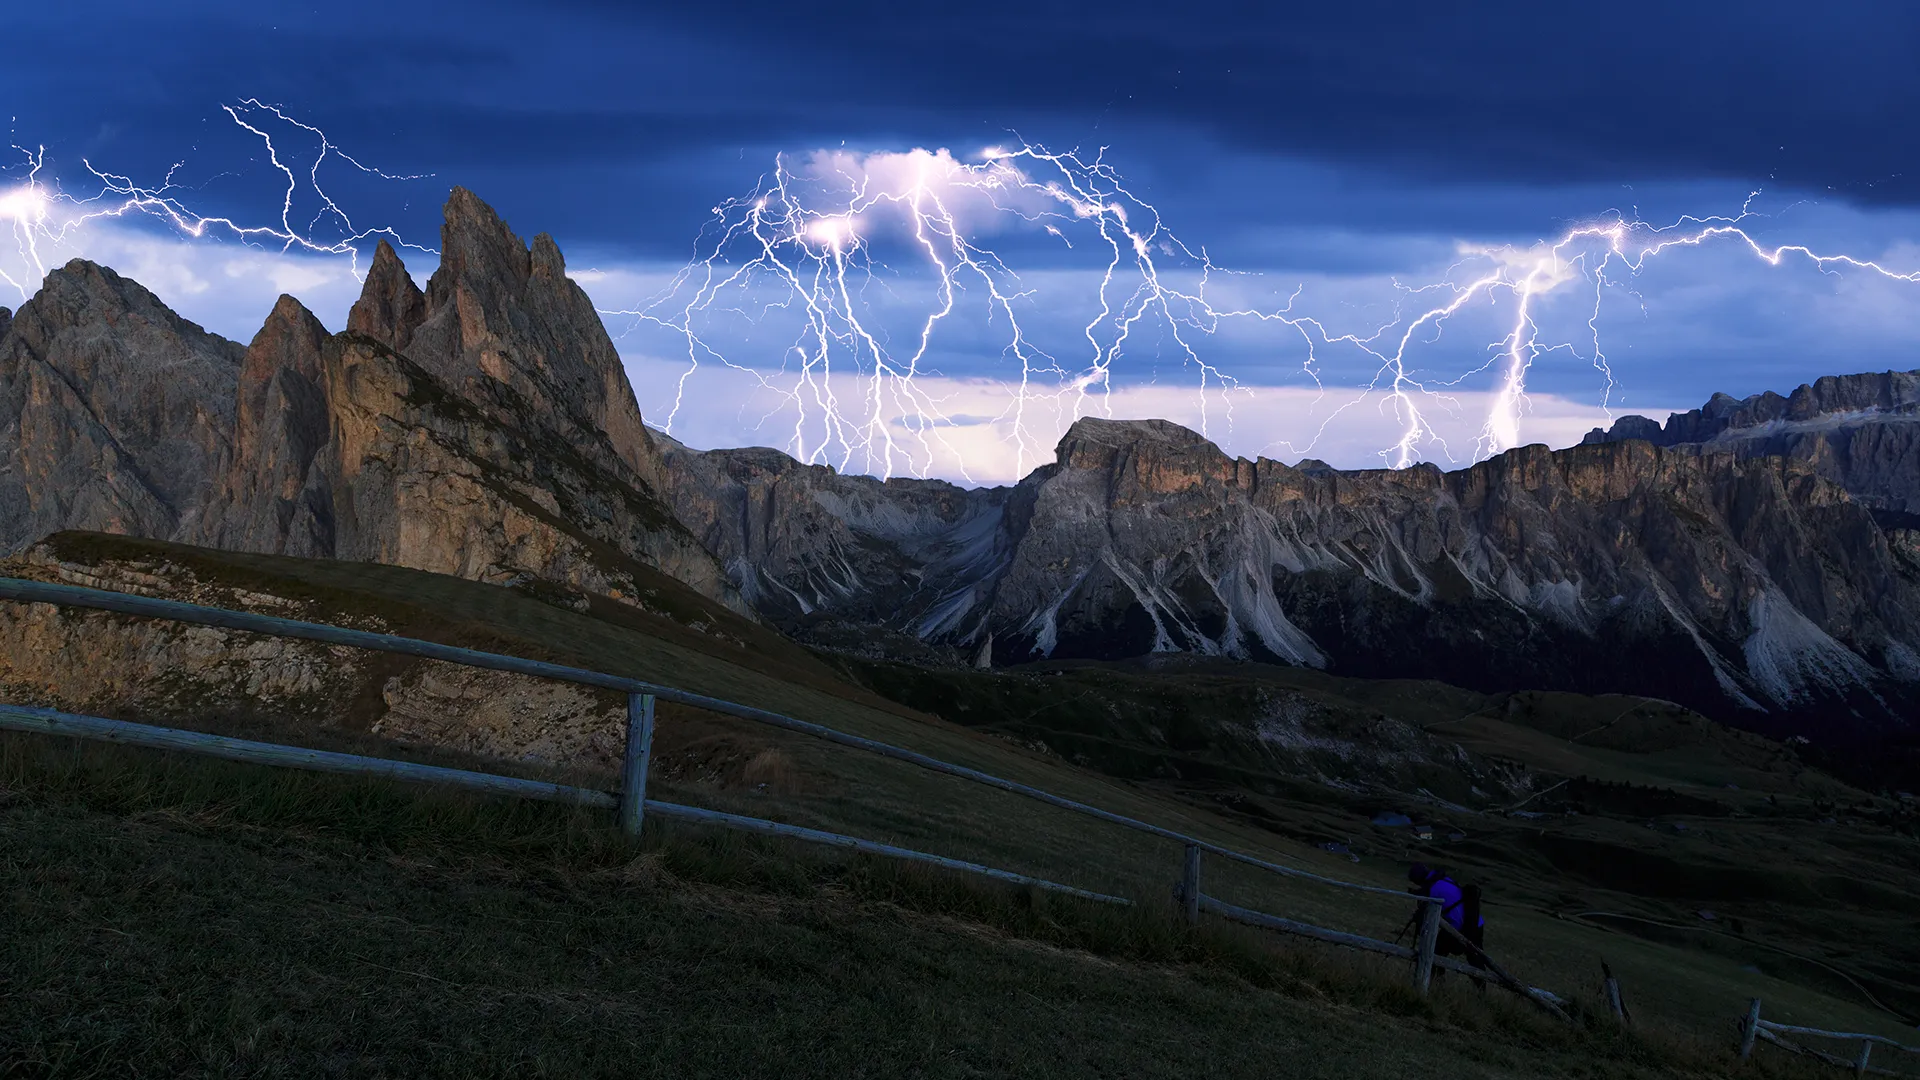
Intense, short-lived summer downpours are expected to become both more frequent and more intense across Alpine regions as the climate warms. In a new study, scientists from the University of Lausanne (UNIL) and the University of Padova analyzed data from nearly 300 mountain weather stations and found that a 2°C rise in regional temperature could double the frequency of these extreme events.

In June 2018, the city of Lausanne in Switzerland experienced an extreme and short-lived rainfall episode, with 41 millimeters of precipitation falling in just 10 minutes. Large parts of the city were flooded, resulting in estimated damage of 32 million Swiss Francs. These short, extreme events, often causing severe damage to property and posing risks to lives, are still very rare in Switzerland today. However, with the rise in temperatures caused by global warming, they are likely to become more frequent in the future, particularly over the Alpine mountains and their surroundings. Warm air retains more moisture (around 7% more per degree) and intensifies thunderstorm activity. As the Alpine region is warming faster than the global average, it is particularly hard hit. It is therefore urgent to assess the impact of global warming in these regions. In a new study published in npj Climate and Atmospheric Science (a Nature portfolio journal), scientists from UNIL’s Faculty of Geosciences and Environment, in collaboration with the University of Padua (UNIPD) have demonstrated that an average temperature rise of 2°C could double the frequency of short-lived summer rainstorms in the Alpine region. With such warming, an intense storm currently expected every 50 years could occur every 25 years in the future.

To obtain these results, the researchers examined data from almost 300 weather stations in the European Alps, spread across Switzerland, Germany, Austria, France, and Italy. They focused on record-breaking rainfall events (lasting from 10 minutes to an hour) between 1991 and 2020, as well as temperatures associated with these storms.

Based on these observations, a statistical model incorporating physics principles has been developed to establish a link between temperature and rainfall frequency, and then to simulate the future frequency of extreme precipitation using regional climate projections. “Our results show that an average temperature rise of 1°C would already be highly problematic,” warns Nadav Peleg, researcher at UNIL and first author of the study. “The sudden and massive arrival of large volumes of water prevents the soil from absorbing the excess. This can trigger flash floods and debris flows, leading to infrastructure damage and, in some cases, casualties,” he adds. “It is therefore crucial to understand how these events may evolve with climate change in order to plan appropriate adaptation strategies, such as improving urban drainage infrastructure where necessary.” Francesco Marra, researcher at UNIPD and one of the main authors of the study adds: “An increase of 1°C is not hypothetical, it is likely to occur in the coming decades. We are already witnessing a tendency for summer storms to intensify, and this trend is only expected to worsen in the years ahead.”

Share Button

Fitness trackers are failing millions — this fix could change everything

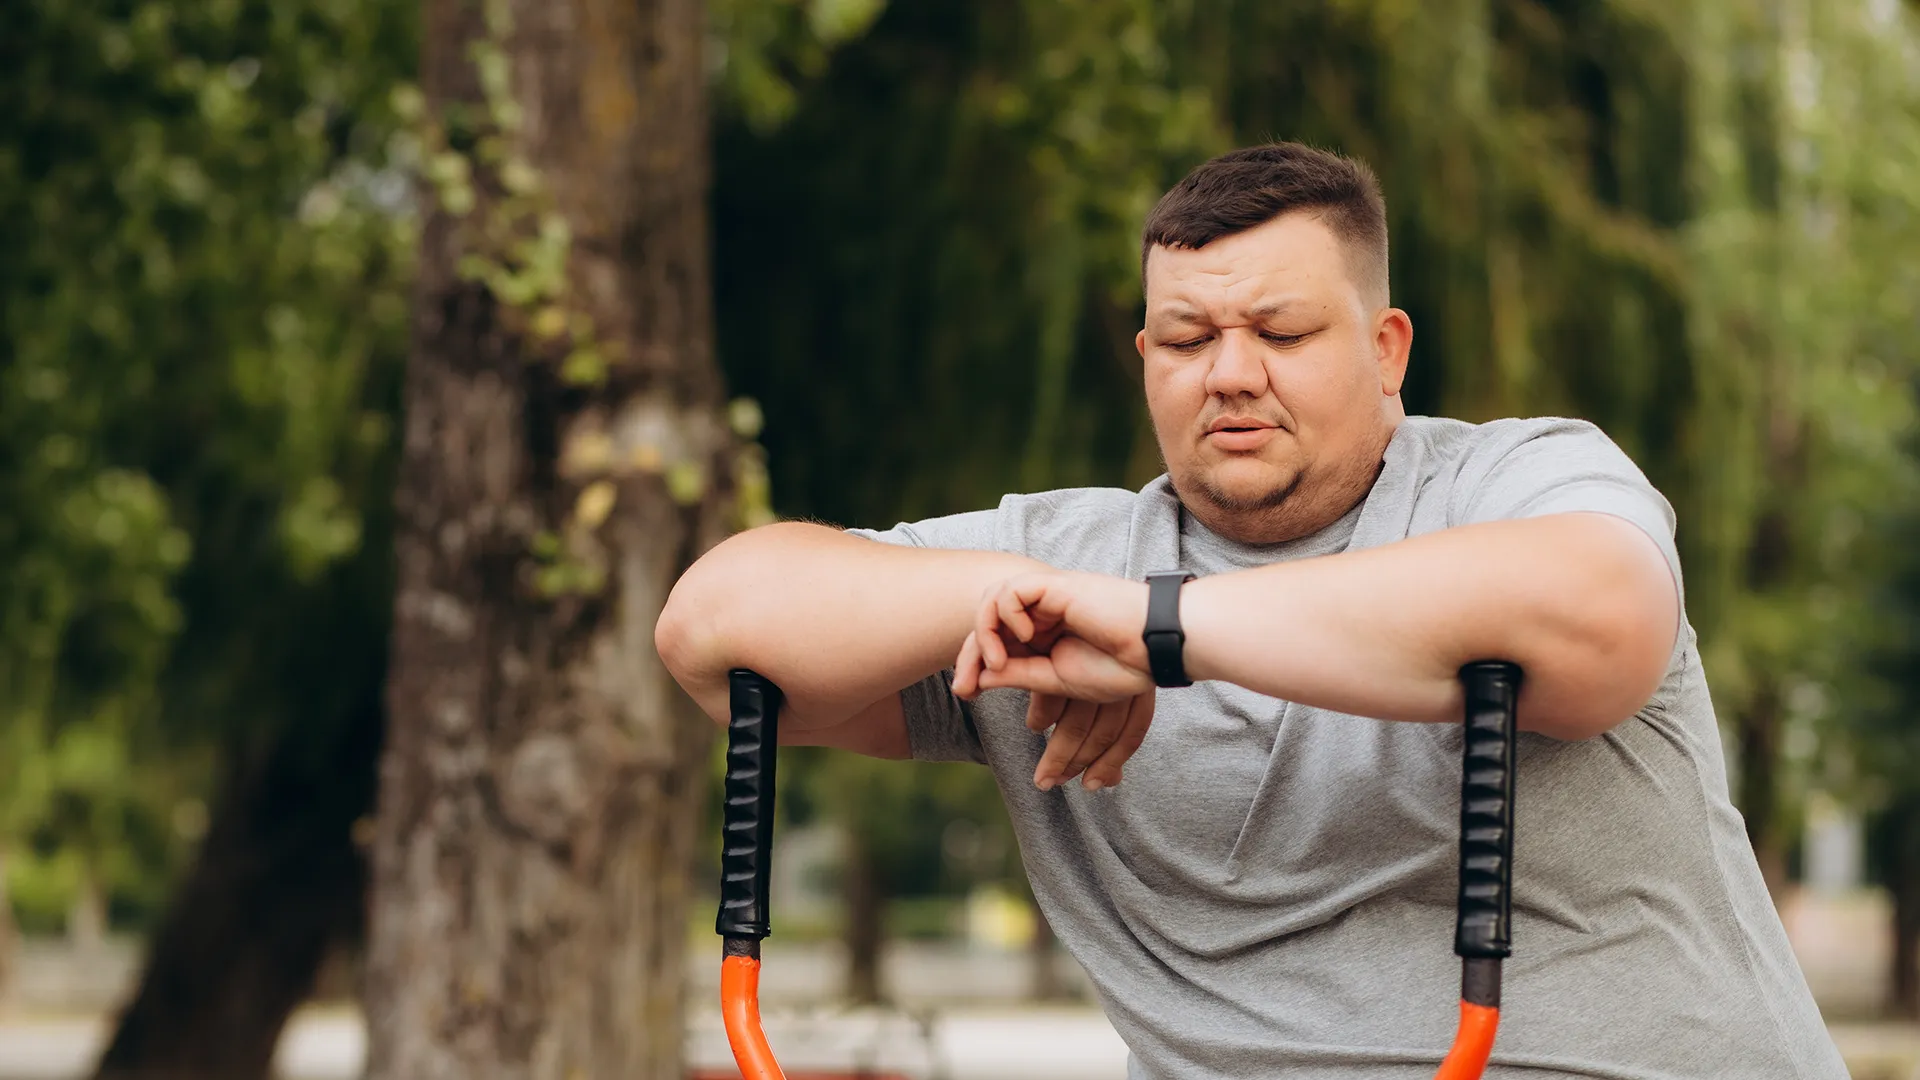
For many, fitness trackers have become indispensable tools for monitoring how many calories they’ve burned in a day. But for those living with obesity, who are known to exhibit differences in walking gait, speed, energy burned and more, these devices often inaccurately measure activity — until now.

h

For many, fitness trackers have become indispensable tools for monitoring how many calories they’ve burned in a day. But for those living with obesity, who are known to exhibit differences in walking gait, speed, energy burned and more, these devices often inaccurately measure activity — until now.

Scientists at Northwestern University have developed a new algorithm that enables smartwatches to more accurately monitor the calories burned by people with obesity during various physical activities.

The technology bridges a critical gap in fitness technology, said Nabil Alshurafa, whose Northwestern lab, HABits Lab, created and tested the open-source, dominant-wrist algorithm specifically tuned for people with obesity. It is transparent, rigorously testable and ready for other researchers to build upon. Their next step is to deploy an activity-monitoring app later this year that will be available for both iOS and Android use.

“People with obesity could gain major health insights from activity trackers, but most current devices miss the mark,” said Alshurafa, associate professor of behavioral medicine at Northwestern University Feinberg School of Medicine.

Current activity-monitoring algorithms that fitness trackers use were built for people without obesity. Hip-worn trackers often misread energy burn because of gait changes and device tilt in people with higher body weight, Alshurafa said. And lastly, wrist-worn models promise better comfort, adherence and accuracy across body types, but no one has rigorously tested or calibrated them for this group, he said.

“Without a validated algorithm for wrist devices, we’re still in the dark about exactly how much activity and energy people with obesity really get each day — slowing our ability to tailor interventions and improve health outcomes,” said Alshurafa, whose team tested his lab’s algorithm against 11 state-of-the-art algorithms designed by researchers using research-grade devices and used wearable cameras to catch every moment when wrist sensors missed the mark on calorie burn.

The findings will be published on June 19 in Nature Scientific Reports.

The exercise class that motivated the research

Alshurafa was motivated to create the algorithm after attending an exercise class with his mother-in-law who has obesity.

“She worked harder than anyone else, yet when we glanced at the leaderboard, her numbers barely registered,” Alshurafa said. “That moment hit me: fitness shouldn’t feel like a trap for the people who need it most.”

Algorithm rivals gold-standard methods

By using data from commercial fitness trackers, the new model rivals gold-standard methods of measuring energy burn and can estimate how much energy someone with obesity is using every minute, achieving over 95% accuracy in real-world situations. This advancement makes it easier for more people with obesity to track their daily activities and energy use, Alshurafa said.

How the study measured energy burn

In one group, 27 study participants wore a fitness tracker and metabolic cart — a mask that measures the volume of oxygen the wearer inhales and the volume of carbon dioxide the wearer exhales to calculate their energy burn (in kilocalories/kCals) and resting metabolic rate. The study participants went through a set of physical activities to measure their energy burn during each task. The scientists then looked at the fitness tracker results to see how they compared to the metabolic cart results.

In another group, 25 study participants wore a fitness tracker and body camera while just living their lives. The body camera allowed the scientists to visually confirm when the algorithm over- or under-estimated kCals.

At times, Alshurafa said he would challenge study participants to do as many pushups as they could in five minutes.

“Many couldn’t drop to the floor, but each one crushed wall-pushups, their arms shaking with effort,” he said, “We celebrate ‘standard’ workouts as the ultimate test, but those standards leave out so many people. These experiences showed me we must rethink how gyms, trackers and exercise programs measure success — so no one’s hard work goes unseen.”

The study is titled, “Developing and comparing a new BMI inclusive energy burn algorithm on wrist-worn wearables.”

Other Northwestern authors include lead author Boyang Wei, and Christopher Romano and Bonnie Nolan. This work also was done in collaboration with Mahdi Pedram and Whitney A. Morelli, formerly of Northwestern.

Funding for the study was provided by the National Institute of Diabetes and Digestive and Kidney Diseases (grants K25DK113242-01A1 and R01DK129843-01), the National Science Foundation (grant 1915847), the National Institute of Biomedical Imaging and Bioengineering (grant R21EB030305-01) and the National Institutes of Health’s National Center for Advancing Translational Sciences (grant UL1TR001422).

Share Button

How does a £1.6m fine affect an NHS trust?

How will the largest fine over maternity deaths impact the NHS and the families it failed?

Share Button

‘I was poisoned by fake Botox’

In recent weeks 28 cases of botulism caused by fake Botox are recorded in the north-east of England.

Share Button

Leeds maternity units downgraded to ‘inadequate’

Trust told to take immediate action to improve after unannounced inspections prompted by parent concerns.

Share Button

Six ways to keep your home and yourself cool in hot weather

Six simple things you can do to help keep your house cool when temperatures rise.

Share Button

UK hits hottest day of the year as heatwave approaches

Alerts across England are in force until Monday morning and come as heatwave conditions are expected.

Share Button