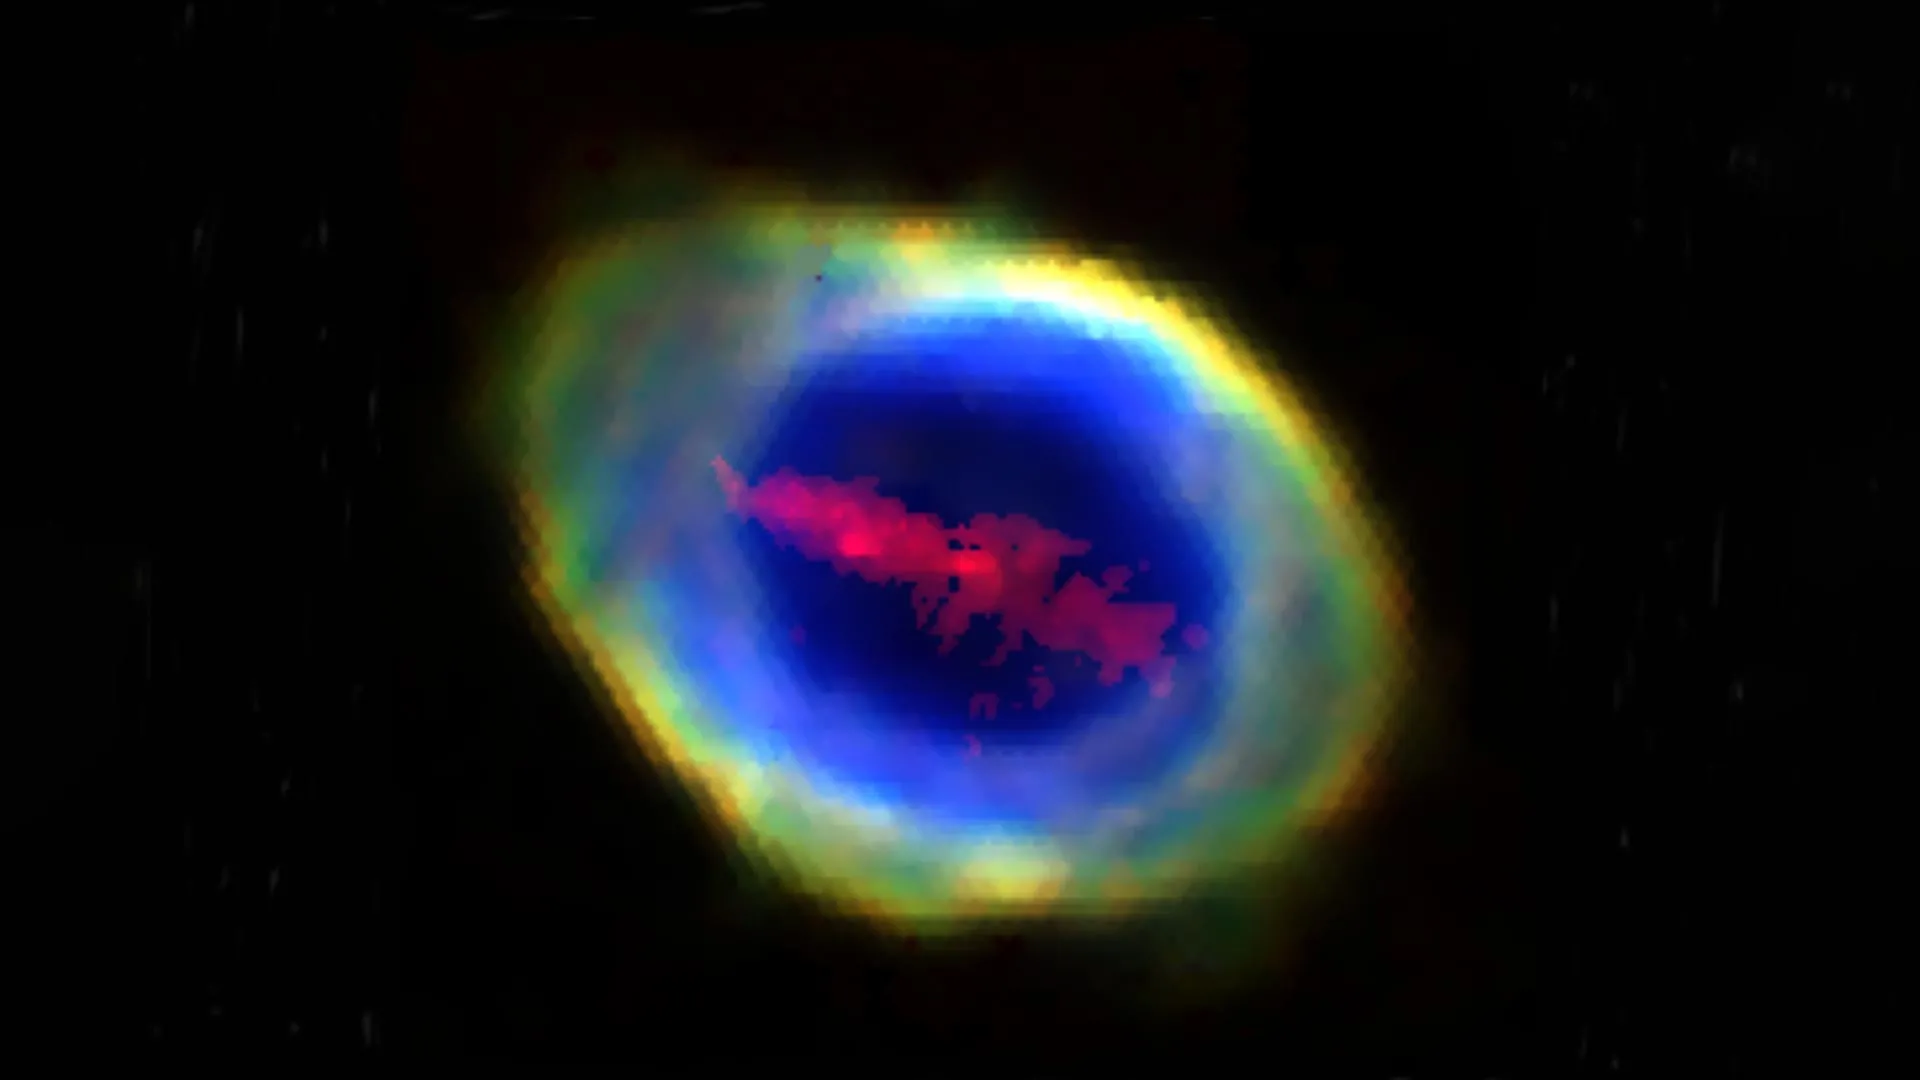
The Ring Nebula is hiding a giant structure made of iron

Astronomers in Europe have identified an unexpected feature hidden inside the famous Ring Nebula. The discovery was made by a team led by researchers at UCL (University College London) and Cardiff University, who found a narrow, bar shaped cloud made of iron deep within the nebula.

The iron cloud is being reported for the first time in Monthly Notices of the Royal Astronomical Society. It forms a long strip that fits neatly inside the nebula’s inner region, which has an elliptical shape seen in many well known images, including those captured by the James Webb Space Telescope at infrared wavelengths.1 The structure is immense. Its length is about 500 times greater than Pluto’s orbit around the Sun, and the total amount of iron it contains is roughly equal to the mass of Mars.

What Makes the Ring Nebula Special

The Ring Nebula was first observed in 1779 by French astronomer Charles Messier in the northern constellation Lyra.2 It is a glowing shell of gas produced when a star reaches the end of its nuclear fuel burning stage and ejects its outer layers into space. Astronomers expect the Sun to shed its outer material in a similar way several billion years from now.3

How the Iron Bar Was Found

The iron cloud was revealed through observations made with the Large Integral Field Unit (LIFU) mode of a new instrument known as the WHT Enhanced Area Velocity Explorer (WEAVE).4 WEAVE is mounted on the Isaac Newton Group’s 4.2-meter William Herschel Telescope.5

LIFU is made up of hundreds of optical fibers working together. This setup allowed the researchers to collect spectra (where light is separated into its constituent wavelengths) from every point across the face of the Ring Nebula, covering all optical wavelengths for the first time.

Seeing the Nebula in a New Way

Lead author Dr. Roger Wesson, who is based at both UCL’s Department of Physics & Astronomy and Cardiff University, described how the finding emerged. “Even though the Ring Nebula has been studied using many different telescopes and instruments, WEAVE has allowed us to observe it in a new way, providing so much more detail than before. By obtaining a spectrum continuously across the whole nebula, we can create images of the nebula at any wavelength and determine its chemical composition at any position.

“When we processed the data and scrolled through the images, one thing popped out as clear as anything — this previously unknown ‘bar’ of ionized iron atoms, in the middle of the familiar and iconic ring.”

Competing Ideas About Its Origin

The researchers say the origin of the iron bar is still unknown. More detailed observations will be needed to understand how it formed. One possibility is that the structure preserves new information about how the dying star expelled its material. Another, more speculative explanation suggests the iron could be part of a curved arc of plasma created when a rocky planet was vaporized during an earlier expansion of the star.

Co author Professor Janet Drew of UCL Physics & Astronomy stressed that key information is still missing. “We definitely need to know more — particularly whether any other chemical elements co-exist with the newly-detected iron, as this would probably tell us the right class of model to pursue. Right now, we are missing this important information.”

What Comes Next for the Research

The team is now preparing a follow up study and plans to gather new data using WEAVE’s LIFU at higher spectral resolution. These observations should help clarify how the iron bar formed and whether other elements are present alongside it.

WEAVE is scheduled to conduct eight major surveys over the next five years, studying objects that range from nearby white dwarfs to extremely distant galaxies. One part of the project, the Stellar, Circumstellar and Interstellar Physics survey led by Professor Drew, is already observing many additional ionised nebulae across the northern Milky Way.

Dr. Wesson noted that similar structures may turn out to be common. “It would be very surprising if the iron bar in the Ring is unique. So hopefully, as we observe and analyze more nebulae created in the same way, we will discover more examples of this phenomenon, which will help us to understand where the iron comes from.”

Professor Scott Trager, WEAVE Project Scientist at the University of Groningen, added: “The discovery of this fascinating, previously unknown structure in a night-sky jewel, beloved by sky watchers across the Northern Hemisphere, demonstrates the amazing capabilities of WEAVE. We look forward to many more discoveries from this new instrument.”

Notes

  1. 1 See e.g. https://www.ucl.ac.uk/news/2023/aug/second-james-webb-image-ring-nebula-hints-dying-stars-companion https://www.cardiff.ac.uk/news/view/2739414-astronomers-spy-structures-that-no-previous-telescope-could-detect-in-new-images-of-dying-star
  2. The Ring Nebula is also known as M 57 — the 57th listing in Messier’s catalogue of ‘Nebulae and Star Clusters’. John L E Dreyer also included it in his New General Catalogue, first published in 1888 by the Royal Astronomical Society, where it appears as NGC 6720.
  3. Once a star like the Sun runs out of hydrogen fuel, it expands to become an extreme red giant and sheds its outer layers, which then coast out to form a glowing shell. A shell created in this way is known in astronomy as a planetary nebula. The leftover stellar core becomes a white dwarf, which, though no longer burning any fuel, continues to shine as it slowly cools over billions of years. The Ring Nebula is a planetary nebula located 2,600 light years (or 787 parsec) away, that is thought to have formed about 4,000 years ago. Planetary nebula ejection returns matter forged in a star to interstellar space and is the source of much of the Universe’s carbon and nitrogen — key building blocks of life on Earth. Stars more than about eight times the mass of the Sun age differently, ending life abruptly in a powerful explosion called a supernova as they collapse to form a black hole or neutron star.
  4. Funding for the WEAVE facility has been provided by UKRI STFC, the University of Oxford, NOVA, NWO, Instituto de Astrofísica de Canarias (IAC), the Isaac Newton Group partners (STFC, NWO, and Spain, led by the IAC), INAF, CNRS-INSU, the Observatoire de Paris, Région Île-de-France, CONACYT through INAOE, the Ministry of Education, Science and Sports of the Republic of Lithuania, Konkoly Observatory (CSFK), Max-Planck-Institut für Astronomie (MPIA Heidelberg), Lund University, the Leibniz Institute for Astrophysics Potsdam (AIP), the Swedish Research Council, the European Commission, and the University of Pennsylvania. The WEAVE Survey Consortium consists of the ING, its three partners, represented by UKRI STFC, NWO, and the IAC, NOVA, INAF, GEPI, INAOE, Vilnius University, FTMC — Center for Physical Sciences and Technology (Vilnius), and individual WEAVE Participants. The WEAVE website can be found at https://weave-project.atlassian.net/wiki/display/WEAVE and the full list of granting agencies and grants supporting WEAVE can be found at https://weave-project.atlassian.net/wiki/display/WEAVE/WEAVE+Acknowledgements.
  5. The William Herschel Telescope is the leading telescope of the Isaac Newton Group (ING), which in turn is part of the Roque de los Muchachos Observatory on La Palma, in the Canary Islands. The ING is jointly operated by the United Kingdom (STFC-UKRI), the Netherlands (NWO) and Spain (IAC, funded by the Spanish Ministry of Science, Innovation and Universities).
Share Button

Scientists sent viruses to space and they evolved in surprising ways

In a new study, terrestrial bacteria-infecting viruses were still able to infect their E. coli hosts in near-weightless “microgravity” conditions aboard the International Space Station, but the dynamics of virus-bacteria interactions differed from those observed on Earth. Phil Huss of the University of Wisconsin-Madison, U.S.A., and colleagues present these findings January 13thin the open-access journal PLOS Biology.

Interactions between phages — viruses that infect bacteria — and their hosts play an integral role in microbial ecosystems. Often described as being in an evolutionary “arms race,” bacteria can evolve defenses against phages, while phages develop new ways to thwart defenses. While virus-bacteria interactions have been studied extensively on Earth, microgravity conditions alter bacterial physiology and the physics of virus-bacteria collisions, disrupting typical interactions.

However, few studies have explored the specifics of how phage-bacteria dynamics differ in microgravity. To address that gap, Huss and colleagues compared two sets of bacterial E. coli samples infected with a phage known as T7 — one set incubated on Earth and the other aboard the International Space Station.

Analysis of the space-station samples showed that, after an initial delay, the T7 phage successfully infected the E. coli. However, whole-genome sequencing revealed marked differences in both bacterial and viral genetic mutations between the Earth samples versus the microgravity samples.

The space-station phages gradually accumulated specific mutations that could boost phage infectivity or their ability to bind receptors on bacterial cells. Meanwhile, the space-station E. coli accumulated mutations that could protect against phages and enhance survival success in near-weightless conditions.

The researchers then applied a high-throughput technique known as deep mutational scanning to more closely examine changes in the T7 receptor binding protein, which plays a key role in infection, revealing further significant differences between microgravity versus Earth conditions. Additional experiments on Earth linked these microgravity-associated changes in the receptor binding protein to increased activity against E. coli strains that cause urinary tract infections in humans and are normally resistant to T7.

Overall, this study highlights the potential for phage research aboard the ISS to reveal new insights into microbial adaption, with potential relevance to both space exploration and human health.

The authors add, “Space fundamentally changes how phages and bacteria interact: infection is slowed, and both organisms evolve along a different trajectory than they do on Earth. By studying those space-driven adaptations, we identified new biological insights that allowed us to engineer phages with far superior activity against drug-resistant pathogens back on Earth.”

In your coverage, please use this URL to provide access to the freely available paper in PLOS Biology: https://plos.io/4q4S9AO

Citation: Huss P, Chitboonthavisuk C, Meger A, Nishikawa K, Oates RP, Mills H, et al. (2026) Microgravity reshapes bacteriophage-host coevolution aboard the International Space Station. PLoS Biol 24(1): e3003568. https://doi.org/10.1371/journal.pbio.3003568

Author countries: United StatesFunding: This work was supported by the Defense Threat Reduction Agency (https://www.dtra.mil/) (Grant HDTRA1-16-1-0049) to S.R. C.C. was supported by a graduate training scholarship from the Anandamahidol Foundation (Thailand). The sponsors or funders did not play any role in the study design, data collection and analysis, decision to publish, or preparation of the manuscript.

Share Button

How scientists are turning thyme into precision medicine

Thyme extract is often described as a powerful natural remedy because of its wide range of health effects. This reputation comes from several biologically active compounds — thymol, carvacrol, rosmarinic acid, and caffeic acid — that are known to support immune function while also offering anti-inflammatory, antimicrobial, and antioxidant benefits.

Despite its potential, thyme extract has practical drawbacks that limit how it can be used. It evaporates quickly (a waste of thyme!), which makes storage and precise delivery difficult. In larger amounts, it can also irritate the body, sometimes leading to skin rashes or digestive discomfort.

A New Way to Preserve and Control Thyme Extract

Scientists have identified a way to solve both of these problems by sealing extremely small droplets of thyme extract inside another liquid. This approach allows the extract to be delivered in very small doses while preventing evaporation. Researchers from Tomsk Polytechnic University and Surgut State University in Russia developed this method for creating encapsulated nanodoses of thyme. Their findings were published in Physics of Fluids, by AIP Publishing.

How the Encapsulation Process Works

The process relies on carefully controlled streams of thyme extract, gelatin, sodium alginate — a commonly used thickening agent in the food industry — and oil. First, the researchers combined thyme extract with gelatin and pushed this mixture through a tiny chip at the same time as a stream of sodium alginate. Inside the chip, the two liquids flowed together while remaining clearly separated. A stream of oil introduced from a perpendicular direction then broke the combined flow into extremely small droplets, each one fully encapsulated.

Why Precision Nanodosing Matters

The most important outcome of this research is not the specific amount of thyme extract used, but the proof that precise and consistent nanodosing is achievable. Before this approach can be applied in medicine, additional work will be needed to package these nanodoses into oral capsules suitable for pharmaceutical use.

“The system tends to be self-regulating in order to deliver a relatively consistent dose, which is valuable for drug delivery,” said author Maxim Piskunov. “At the same time, changing and adjusting the diameter of the microdroplets containing a biologically active substance nanodose is only possible by varying the oil phase flow rate.”

Applications Beyond Medicine

The researchers emphasize that the technique is not limited to thyme extract alone. It could also be used for other substances and has potential applications outside pharmaceuticals, including the food industry. Piskunov added that combining this method with machine vision and artificial intelligence could allow real-time monitoring and control of nanodosing.

“We believe that this method can be used to encapsulate various aqueous extracts,” said Piskunov. “From our study, no significant limitations have been identified. Moreover, we are currently working on encapsulating a water-alcohol extract with a much higher concentration of biologically active substances.”

Share Button

AI maps the hidden forces shaping cancer survival worldwide

For the first time, scientists have applied machine learning, a form of artificial intelligence (AI), to identify the factors most closely linked to cancer survival in nearly every country across the globe.

The research, publishedin the leading cancer journal Annals of Oncology, goes beyond broad comparisons to show which specific policy changes or system improvements could have the greatest impact on cancer survival in each nation. The team has also created an online tool that allows users to select a country and see how factors such as national wealth, access to radiotherapy, and universal health coverage relate to cancer outcomes.

Turning Global Data Into Practical Insights

Dr. Edward Christopher Dee, a resident physician in radiation oncology at Memorial Sloan Kettering (MSK) Cancer Center in New York, USA, and a co-leader of the study, highlighted why the work matters. “Global cancer outcomes vary greatly, largely due to differences in national health systems. We wanted to create an actionable, data-driven framework that helps countries identify their most impactful policy levers to reduce cancer mortality and close equity gaps.”

He noted that several factors consistently stood out. “We found that access to radiotherapy, universal health coverage and economic strength were often important levers being associated with better national cancer outcomes. However, other key factors were relevant as well.”

Analyzing Cancer and Health System Data From 185 Countries

To reach these conclusions, Dr. Dee and his colleagues used machine learning to examine cancer incidence and death data from the Global Cancer Observatory (GLOBOCAN 2022), covering 185 countries. They combined this information with health system data gathered from the World Health Organization, the World Bank, United Nations agencies, and the Directory of Radiotherapy Centres.

The dataset included health spending as a percentage of GDP, GDP per capita, the number of physicians, nurses, midwives, and surgical workers per 1000 people, levels of universal health coverage, access to pathology services, a human development index, the number of radiotherapy centers per 1000 people, a gender inequality index, and the share of healthcare costs paid directly by patients.

Building the Machine Learning Model

The machine learning model was developed by Mr, Milit Patel, the study’s first author. He is a researcher in biochemistry, statistics and data science, healthcare reform and innovation at the University of Texas at Austin, USA, and at MSK.

Mr, Patel explained the reasoning behind this approach. “We chose to use machine learning models because they allow us to generate estimates – and related predictions – specific to each country. We are, of course, aware of the limitations of population level data but hope these findings can guide cancer system planning globally.”

Measuring Cancer Care Effectiveness

The model calculates mortality-to-incidence ratios (MIR), which represent the share of cancer cases that result in death and serve as an indicator of how effective cancer care is in a given country. To show how individual factors influence these estimates, the researchers used a method that explains predictions by measuring each variable’s contribution, known as SHAP (Shapley Additive exPlanations).

According to Mr. Patel, the goal was to move from description to action. “Beyond simply describing disparities, our approach provides actionable, data-driven roadmaps for policymakers, showing precisely which health system investments are associated with the greatest impact for each country. As the global cancer burden grows, these insights can help nations prioritize resources and close survival gaps in the most equitable and effective way possible. International organizations, healthcare providers, and advocates may also use the web-based tool to highlight areas for investment, especially in resource-limited settings.”

Country Examples Show Different Priorities

The results reveal that the most influential factors vary widely by country. In Brazil, the model indicates that universal health coverage (UHC) has the strongest positive association with improved mortality-to-incidence ratios. Other factors, such as pathology services and the number of nurses and midwives per 1000 people, appear to play a smaller role at present. The researchers suggest this means Brazil could see the greatest gains by prioritizing UHC.

In Poland, the availability of radiotherapy services, GDP per capita, and the UHC index show the largest impact on cancer outcomes. This pattern suggests that recent efforts to expand health insurance and access to care have produced stronger improvements than general health spending, which appears to have a more limited effect.

Japan, the USA, and the UK show a broader pattern, with nearly all health system factors linked to better cancer outcomes. In Japan, the density of radiotherapy centers stands out most strongly, while in the USA and the UK, GDP per capita has the greatest influence. These findings point to where policymakers in each country may achieve the biggest gains.

China presents a more mixed picture. Higher GDP per capita, broader UHC, and greater access to radiotherapy centers contribute most to improved cancer outcomes. By contrast, out-of-pocket spending, the size of the surgical workforce per 1000 people, and health spending as a percentage of GDP currently explain less of the variation in outcomes.

The researchers write about China: “High direct costs for patients remain a critical barrier to optimal cancer outcomes, even amidst national improvements in health financing and access. These findings underscore that while China’s rapid health system development is yielding important gains in cancer control, disparities in financial protection and coverage persist, warranting intensified policy focus on reducing out-of-pocket expenditures and further strengthening UHC implementation to maximize health system impact.”

How to Read the Green and Red Bars

Mr, Patel also explained the meaning of the green and red bars shown in the country-specific graphs. “The green bars represent factors that currently appear most strongly and positively associated with improved cancer outcomes in a given country. These are areas where continued or increased investment is most likely to result in meaningful impact.”

He stressed that red bars should not be misunderstood. “However, the red bars do not indicate that these areas are unimportant or should be neglected. Rather, they reflect domains that, according to the model and current data, are less likely to explain the largest differences in outcomes right now. This may be due to already strong performance in these aspects, limitations of the available data, or other context-specific factors.”

He added an important caution. “Importantly, seeing a ‘red’ bar should never be interpreted as a reason to stop efforts to strengthen that pillar of cancer care – improvement in those areas can still be valuable for a country’s overall health system. Our results simply suggest that, if the goal is to maximize improvement in cancer outcomes as defined by the model, focusing first on the strongest positive (green) drivers may be the most impactful strategy.”

Strengths, Limits, and What Comes Next

The study’s strengths include its coverage of nearly all countries, use of current global health data, country-specific policy guidance rather than simple global averages, and the use of more transparent AI models. The researchers also acknowledge key limitations. The analysis relies on national-level data rather than individual patient records, data quality varies widely, especially in many low-income countries, and national trends can hide disparities within countries. In addition, the study cannot prove that focusing on a specific factor will cause better cancer outcomes, only that such efforts are associated with improved results.

Even with these limits, the findings offer a useful way to prioritize action. Dr. Dee concluded: “As the global cancer burden grows, this model helps countries maximize impact with limited resources. It turns complex data into understandable, actionable advice for policymakers, making precision public health possible.”

Share Button

Tiny earthquakes are revealing a dangerous secret beneath California

By closely tracking swarms of extremely small earthquakes, scientists are gaining new insight into a dangerous and complicated region off the Northern California coast. This area marks the meeting point of the San Andreas fault and the Cascadia subduction zone, a place capable of producing powerful and destructive earthquakes. The research was carried out by scientists from the U.S. Geological Survey, the University of California, Davis and the University of Colorado Boulder, and was published Jan. 15 in Science.

“If we don’t understand the underlying tectonic processes, it’s hard to predict the seismic hazard,” said coauthor Amanda Thomas, professor of earth and planetary sciences at UC Davis.

A Seismic Crossroads Beneath the Coast

The Mendocino Triple Junction lies offshore from Humboldt County, where three major tectonic plates converge. South of this junction, the Pacific plate moves roughly northwest alongside the North American plate, creating the San Andreas fault. To the north, the Gorda (or Juan de Fuca) plate moves northeast and sinks beneath the North American plate, descending into the Earth’s mantle in a process known as subduction.

Although this arrangement may appear simple on a map, scientists say the real structure below the surface is far more complicated. One striking example came from a large (magnitude 7.2) earthquake in 1992 that struck at a much shallower depth than expected.

Looking Below the Surface

First author David Shelly of the USGS Geologic Hazards Center in Golden, Colo., said the challenge is similar to studying an iceberg.

“You can see a bit at the surface, but you have to figure out what is the configuration underneath,” Shelly said.

To uncover that hidden structure, Shelly and his colleagues used a dense network of seismometers across the Pacific Northwest. The instruments recorded extremely small “low-frequency” earthquakes that occur where tectonic plates slowly slide against or over one another. These tiny events are thousands of times weaker than earthquakes people can feel at the surface.

The team tested their underground model by examining how these small earthquakes respond to tidal forces. Just as the gravitational pull of the Sun and Moon affects ocean tides, it also places subtle stress on tectonic plates. When those forces line up with the natural direction of plate movement, the number of small earthquakes increases, Thomas said.

Five Moving Pieces Beneath Northern California

The researchers found that the region involves five moving pieces rather than just three major plates, with two of them hidden deep below the surface.

At the southern end of the Cascadia subduction zone, the team discovered that a portion of the North American plate has broken away and is being dragged downward along with the Gorda plate as it sinks beneath North America.

South of the triple junction, the Pacific plate is pulling a mass of rock known as the Pioneer fragment beneath the North American plate as it moves northwards. The fault separating the Pioneer fragment from the North American plate lies nearly flat and cannot be seen at the surface.

The Pioneer fragment was once part of the Farallon plate, an ancient tectonic plate that once extended along the California coastline and has since mostly disappeared.

Explaining a Puzzling Earthquake

This updated model helps explain why the 1992 earthquake occurred at such a shallow depth. According to Materna, the surface being pushed beneath North America is not as deep as scientists previously believed.

“It had been assumed that faults follow the leading edge of the subducting slab, but this example deviates from that,” Materna said. “The plate boundary seems not to be where we thought it was.”

The work was supported by a grant from the National Science Foundation.

Share Button

Is fibre the new protein? The surprising health benefits of the latest wellness trend

It was once seen as an “unsexy nutrient” but its health benefits beyond the bowel are now in the spotlight.

Share Button

Paracetamol is safe in pregnancy, says study refuting Trump autism claims

Researchers say their gold-standard review should put an end to the debate over use of the common painkiller during pregnancy.

Share Button

Life-extending prostate cancer drug to be offered to thousands in England

Abiraterone will be available in a matter of weeks and will be offered to 7,000 men a year.

Share Button

Hospital violated trans complaint nurses’ dignity, tribunal rules

A judge says the hospital chiefs’ changing room policy created a “hostile” environment for women.

Share Button

A Makeup Artist Reveals 5 Reasons You’re Looking Tired Even When You’re Not

You slept eight hours, drank adequate water, and yet it still appears as if you just pulled an all-nighter. Sound familiar? As it turns out, that perpetually “tired” look has way less to do with exhaustion — and everything to do with the way your face is being visually pulled downward, dulled and flattened by subtle makeup and skin care mistakes you probably don’t even realize you’re making.

From concealer placement to foundation undertone, tiny missteps can quietly drain the life out of your face. The good news? A few pro-level tweaks can make you look instantly brighter, lifted and well-rested.

1. You’re not prepping your skin before makeup

According to Nikki DeRoest, a celebrity makeup artist and CEO and founder of Ciele Cosmetics, makeup can only do so much if the skin underneath isn’t prepped properly. “When skin is dehydrated or overworked, makeup tends to sit on top instead of melting in, which instantly makes the complexion look tired — even when everything else is applied correctly,” she said.

Start with a gentle cleanser so your skin feels balanced, not tight, then layer on a hydrating serum and moisturizer to help makeup melt in instead of sitting on top. Also, don’t skip the eye area — hydrated under-eyes means your concealer is less likely to crease.

2. Your foundation isn’t the right undertone

“Undertone mismatch is one of the biggest reasons makeup can look dull or off,” DeRoest said. “If your foundation pulls too yellow, too pink or too gray for your skin, it’ll actually exaggerate shadows and make you look more exhausted rather than brighten.”

One way to decipher your undertone is to look at the veins on your wrist: blue or purple veins usually mean cool undertones, while greenish veins point to warm undertones — and a mix of both suggests neutral. That said, many color analysts and makeup artists point out that this test isn’t always reliable, especially on deeper or olive-toned skin where vein color can be affected by skin depth and lighting.

You can also try paying attention to how your skin reacts when your skin is exposed to the sun. People with cooler undertones tend to burn or turn pink before they tan, while warmer undertones usually tan more easily and develop a golden or olive cast. If you burn first but eventually tan, or if your skin doesn’t fit neatly into either category, you likely fall somewhere in the neutral or olive range.

When testing foundation, DeRoest suggests swiping a few shades along your jawline in natural light. “The right shade shouldn’t change the color of your face or neck — it should disappear into the skin,” she said.

3. You’re misapplying concealer

Concealer application can completely change whether you look rested or run-down. “One of the most common mistakes I see is over-concealing under the eyes,” DeRoest said. “Applying too much product across the entire area can drag the face down and emphasize fatigue.”

Instead, she suggested placing the concealer only where you can actually see darkness — usually the inner corner and outer corner — to lift and brighten. The goal isn’t to erase your under-eyes with a thick layer, but to strategically neutralize shadows so your skin looks awake, smooth and refreshed.

When it comes to finding your perfect concealer shade, one shade lighter than your foundation is usually the sweet spot — bright enough to lift the under-eye, but not so light that it turns gray or emphasizes fine lines.

Undertone is also important: If you have cool or pink-leaning skin, your under-eye darkness is likely to show up as bluish or violet, so a concealer with a soft peach or salmon tone will neutralize shadows better than a straight beige. If you’re warm or golden, your under-eye circles often look more brown or gray, which means a golden-peach or apricot-toned concealer will brighten more naturally.

4. You’re skipping highlighting and contouring

“When everything on the face is the same tone — foundation, concealer, powder — the skin can look flat and washed out,” DeRoest said. “What brings the face back to life is subtle contrast, dimension and strategic highlights.”

Enter highlighting and contouring. Natural skin has highs and lows — light naturally hits the tops of your cheekbones, the bridge of your nose and the center of your forehead, while shadows fall under the cheekbones and along the jaw.

DeRoest suggested using a slightly brighter concealer on the high points of the face, such as the outer corners of the eyes for lift and around the mouth where shadows tend to form. “Those small highlights can completely change how awake someone looks,” she said. When it comes to contour, the most important areas are right under the cheekbones, starting near the ear and stopping before the middle of the eye. This creates the illusion of higher, more lifted cheeks, which makes you look more well-rested.

5. You’re neglecting the inner eye corner

The inner corner of the eye is one of the most powerful — and most overlooked — areas when it comes to looking awake. This spot naturally falls into shadow, which can make eyes appear smaller, deeper-set and more tired, even if you’re well-rested. “A small amount of brightening concealer there instantly opens up the eyes and makes you look more awake,” DeRoest said.

Choose a shade that’s one to two shades lighter than your under-eyes, but not starkly white — think soft brightness, not highlighter. A thin, creamy formula with a luminous or satin finish (not flat matte) is key here, as it helps reflect light out of that natural hollow and creates the illusion of bigger, more open eyes.

You can also layer a subtle shimmer or satin highlight on top — think champagne or soft pearl, not glitter — with a tiny brush or your fingertip. Keep the product concentrated in the inner corner rather than dragging it across the whole lid. This targeted pop of brightness reflects light back into the eyes.

Share Button