Black coffee, longer life: The science behind your morning perk

While you’re probably not pouring your morning cup for the long-term health benefits, coffee consumption has been linked to lower risk of mortality. In a new observational study, researchers from the Gerald J. and Dorothy R. Friedman School of Nutrition Science and Policy at Tufts University found the association between coffee consumption and mortality risk changes with the amount of sweeteners and saturated fat added to the beverage.

The study, published online in The Journal of Nutrition, found that consumption of 1-2 cups of caffeinated coffee per day was linked to a lower risk of death from all causes and death from cardiovascular disease. Black coffee and coffee with low levels of added sugar and saturated fat were associated with a 14% lower risk of all-cause mortality as compared to no coffee consumption. The same link was not observed for coffee with high amounts of added sugar and saturated fat.

“Coffee is among the most-consumed beverages in the world, and with nearly half of American adults reporting drinking at least one cup per day, it’s important for us to know what it might mean for health,” said Fang Fang Zhang, senior author of the study and the Neely Family Professor at the Friedman School. “The health benefits of coffee might be attributable to its bioactive compounds, but our results suggest that the addition of sugar and saturated fat may reduce the mortality benefits.”

The study analyzed data from nine consecutive cycles of the National Health and Nutrition Examination Survey (NHANES) from 1999 to 2018, linked to National Death Index Mortality Data. The study included a nationally representative sample of 46,000 adults aged 20 years and older who completed valid first-day 24-hour dietary recalls. Coffee consumption was categorized by type (caffeinated or decaffeinated), sugar, and saturated fat content. Mortality outcomes included all-cause, cancer, and cardiovascular disease. Low added sugar (from granulated sugar, honey, and syrup) was defined as under 5% of the Daily Value, which is 2.5 grams per 8-ounce cup or approximately half a teaspoon of sugar. Low saturated fat (from milk, cream, and half-and-half) was defined as 5% of the Daily Value, or 1 gram per 8-ounce cup or the equivalent of 5 tablespoons of 2% milk, 1 tablespoon of light cream, or 1 tablespoon of half-and-half.

In the study, consumption of at least one cup per day was associated with a 16% lower risk of all-cause mortality. At 2-3 cups per day, the link rose to 17%. Consumption beyond three cups per day was not associated with additional reductions, and the link between coffee and a lower risk of death by cardiovascular disease weakened when coffee consumption was more than three cups per day. No significant associations were seen between coffee consumption and cancer mortality.

“Few studies have examined how coffee additives could impact the link between coffee consumption and mortality risk, and our study is among the first to quantify how much sweetener and saturated fat are being added,” said first author Bingjie Zhou, a recent Ph.D. graduate from the nutrition epidemiology and data science program at the Friedman School. “Our results align with the Dietary Guidelines for Americans which recommend limiting added sugar and saturated fat.”

Limitations of the study include the fact that self-reported recall data is subject to measurement error due to day-to-day variations in food intake. The lack of significant associations between decaffeinated coffee and all-cause mortality could be due to the low consumption among the population studied.

Additional authors are Yongyi Pan and Lu Wang, both of the Friedman School, and Mengyuan Ruan, a graduate of the Friedman School.

The study was supported by the National Institutes of Health’s National Institute on Minority Health and Health Disparities under award number R01MD011501. Complete information on methodology is available in the published paper. The content is the sole responsibility of the authors and does not necessarily represent the official views the National Institutes of Health.

Share Button

MPs to vote on decriminalising abortion – how the law could change

Two Labour MPs have tabled rival amendments to the Crime and Policing Bill on abortion.

Share Button

Rise in awareness of nicotine pouches among children, survey suggests

A survey carried out by YouGov indicates 4% of children aged 11-17 have also tried them.

Share Button

Warning over TikTok filming by hospital patients

The Society of Radiographers says more patients are filming for social media without permission.

Share Button

Robots that feel heat, pain, and pressure? This new “skin” makes it possible

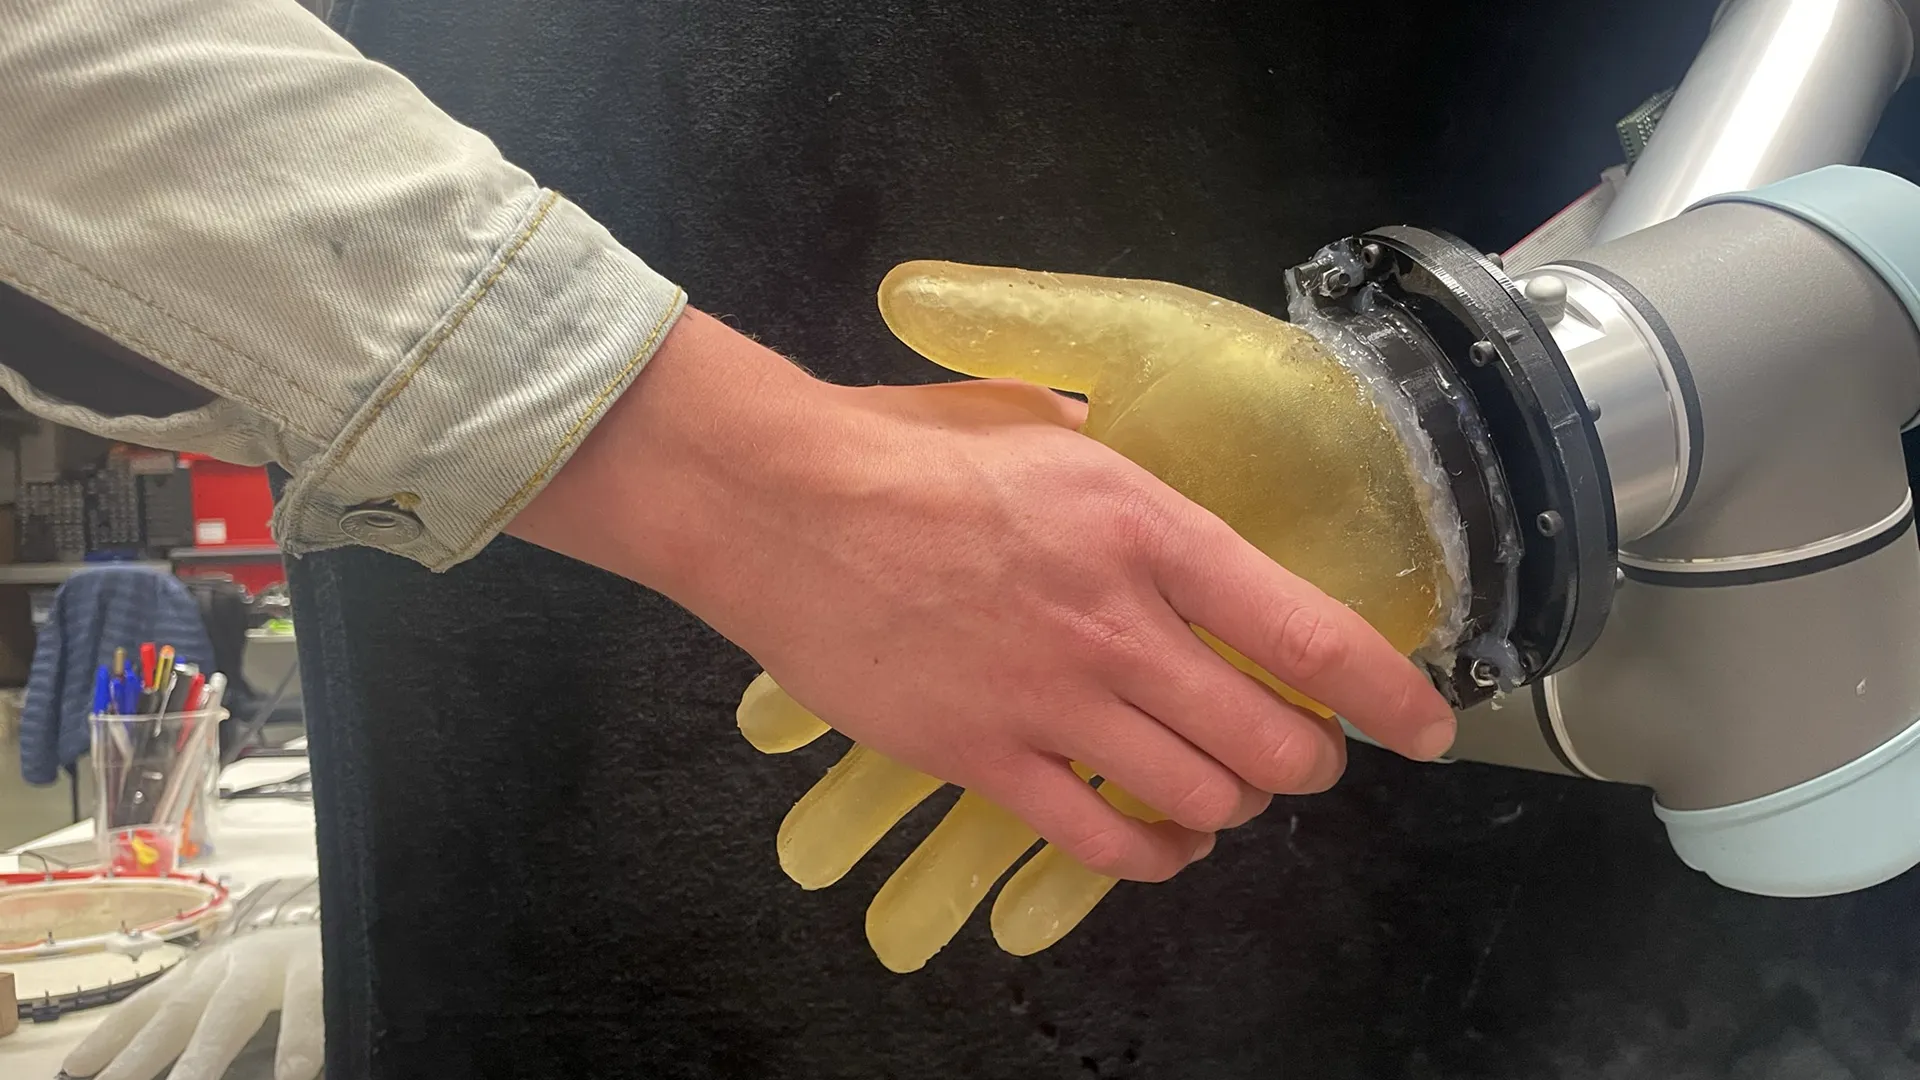
Scientists have developed a low-cost, durable, highly-sensitive robotic ‘skin’ that can be added to robotic hands like a glove, enabling robots to detect information about their surroundings in a way that’s similar to humans.

The researchers, from the University of Cambridge and University College London (UCL), developed the flexible, conductive skin, which is easy to fabricate and can be melted down and formed into a wide range of complex shapes. The technology senses and processes a range of physical inputs, allowing robots to interact with the physical world in a more meaningful way.

Unlike other solutions for robotic touch, which typically work via sensors embedded in small areas and require different sensors to detect different types of touch, the entirety of the electronic skin developed by the Cambridge and UCL researchers is a sensor, bringing it closer to our own sensor system: our skin.

Although the robotic skin is not as sensitive as human skin, it can detect signals from over 860,000 tiny pathways in the material, enabling it to recognise different types of touch and pressure – like the tap of a finger, a hot or cold surface, damage caused by cutting or stabbing, or multiple points being touched at once – in a single material.

The researchers used a combination of physical tests and machine learning techniques to help the robotic skin ‘learn’ which of these pathways matter most, so it can sense different types of contact more efficiently.

In addition to potential future applications for humanoid robots or human prosthetics where a sense of touch is vital, the researchers say the robotic skin could be useful in industries as varied as the automotive sector or disaster relief. The results are reported in the journal Science Robotics.

Electronic skins work by converting physical information – like pressure or temperature – into electronic signals. In most cases, different types of sensors are needed for different types of touch – one type of sensor to detect pressure, another for temperature, and so on – which are then embedded into soft, flexible materials. However, the signals from these different sensors can interfere with each other, and the materials are easily damaged.

“Having different sensors for different types of touch leads to materials that are complex to make,” said lead author Dr David Hardman from Cambridge’s Department of Engineering. “We wanted to develop a solution that can detect multiple types of touch at once, but in a single material.”

“At the same time, we need something that’s cheap and durable, so that it’s suitable for widespread use,” said co-author Dr Thomas George Thuruthel from UCL.

Their solution uses one type of sensor that reacts differently to different types of touch, known as multi-modal sensing. While it’s challenging to separate out the cause of each signal, multi-modal sensing materials are easier to make and more robust.

The researchers melted down a soft, stretchy and electrically conductive gelatine-based hydrogel, and cast it into the shape of a human hand. They tested a range of different electrode configurations to determine which gave them the most useful information about different types of touch. From just 32 electrodes placed at the wrist, they were able to collect over 1.7 million pieces of information over the whole hand, thanks to the tiny pathways in the conductive material.

The skin was then tested on different types of touch: the researchers blasted it with a heat gun, pressed it with their fingers and a robotic arm, gently touched it with their fingers, and even cut it open with a scalpel. The team then used the data gathered during these tests to train a machine learning model so the hand would recognize what the different types of touch meant.

“We’re able to squeeze a lot of information from these materials – they can take thousands of measurements very quickly,” said Hardman, who is a postdoctoral researcher in the lab of co-author Professor Fumiya Iida. “They’re measuring lots of different things at once, over a large surface area.”

“We’re not quite at the level where the robotic skin is as good as human skin, but we think it’s better than anything else out there at the moment,” said Thuruthel. “Our method is flexible and easier to build than traditional sensors, and we’re able to calibrate it using human touch for a range of tasks.”

In future, the researchers are hoping to improve the durability of the electronic skin, and to carry out further tests on real-world robotic tasks.

The research was supported by Samsung Global Research Outreach Program, the Royal Society, and the Engineering and Physical Sciences Research Council (EPSRC), part of UK Research and Innovation (UKRI). Fumiya Iida is a Fellow of Corpus Christi College, Cambridge.

Share Button

The invisible killer: PM 1 pollution uncovered across America

Air pollution causes health problems and is attributable to some 50,000 annual deaths in the United States, but not all air pollutants pack the same punch.

Scientists have tracked the scope of “PM 2.5” pollution over decades. PM 2.5 is a size of “particulate matter” that is less than 2.5 microns in diameter. But less information was available about its even tinier cousin, described as “submicron” or “PM 1” particulate matter, which is less than 1 micron in diameter. Why does that matter? Because the “little guys” might be the source of worse health effects.

With a study now published in The Lancet Planetary Health, researchers at Washington University in St. Louis have quantified the amount of PM 1 over the United States from the past 25 years.

“This measurement serves as a starting point to understand which pollutants regulators could target to make the most effective health impact,” said Randall Martin, the Raymond R. Tucker Distinguished Professor of energy, environmental and chemical engineering in the McKelvey School of Engineering. “This effort builds upon WashU’s strengths in satellite remote sensing and modeling atmospheric aerosols that were leveraged in this study,” he added.

Chi Li, research assistant professor in Martin’s atmospheric composition analysis group, is the first author of the work. Li said these estimates will enable further investigation into both the health and environmental effects of submicron particles.

Li said the very small particles quantified in this study generally come from direct air emissions, such as the black carbon particles released by diesel engines or the smoke from wildfires. Sometimes PM 1 can also form through secondary processes when sulfur dioxide or nitrogen oxides are spit out through fuel combustion and burning coal.

It makes intuitive sense that smaller particles of air pollution could do more damage to the human body because they are able to slip past the body’s innate defenses. These submicron particles are at least 6 times smaller than blood cells.

Air particles are not always one single thing, but mixtures of other materials stacked together.

The larger sizes of particles are critically more dominated by components that are not easily modifiable like mineral dust, noted Li.

The researchers were able to calculate their submicron estimates based on the known ratios of what makes up PM 2.5 particles, which include seven main components such as sulfate, nitrate and mineral dust.

“Putting the seven species together, we can calculate the total PM 1 concentration over the country,” Li said.

This research sets the stage for further analysis of where, how and why certain types of particles congregate, and how they can affect the environment and human body.

“When EPA first promulgated a fine PM air quality standard in 1997, there was considerable discussion about regulating PM 1 or PM2.5,” said Jay Turner, the James McKelvey Professor of Engineering Education and co-author on the study. “For numerous reasons, including but not limited to the lack of health impacts studies for PM 1 compared to studies for PM 2.5, the latter was chosen. This study provides a comprehensive, nationwide dataset to examine PM1 impacts on health.”

A next step will involve working with epidemiologists to assess the association of PM 1 with health outcomes.

The new dataset revealed another notable fact: pollution regulation does help. Across the contiguous U.S., average PM 1 levels in the air people breathe dropped sharply from 1998 to 2022, thanks to decades of environmental regulations like the Clean Air Act. However, this progress has slowed since 2010, mainly because of rising wildfire activity. Future pollution controls will need to address emerging, non-fossil fuel sources, study authors said.

Other countries like China have a head start tracking nationwide PM 1, but now the U.S. can quickly catch up.

“This dataset offers unprecedented information for the United States about an important pollutant for which few other measurements exist,” Martin said.

Funding from National Institute of Environmental Health Sciences, National Institutes of Health.

Share Button

Magnetic mayhem at the sun’s poles: First images reveal a fiery mystery

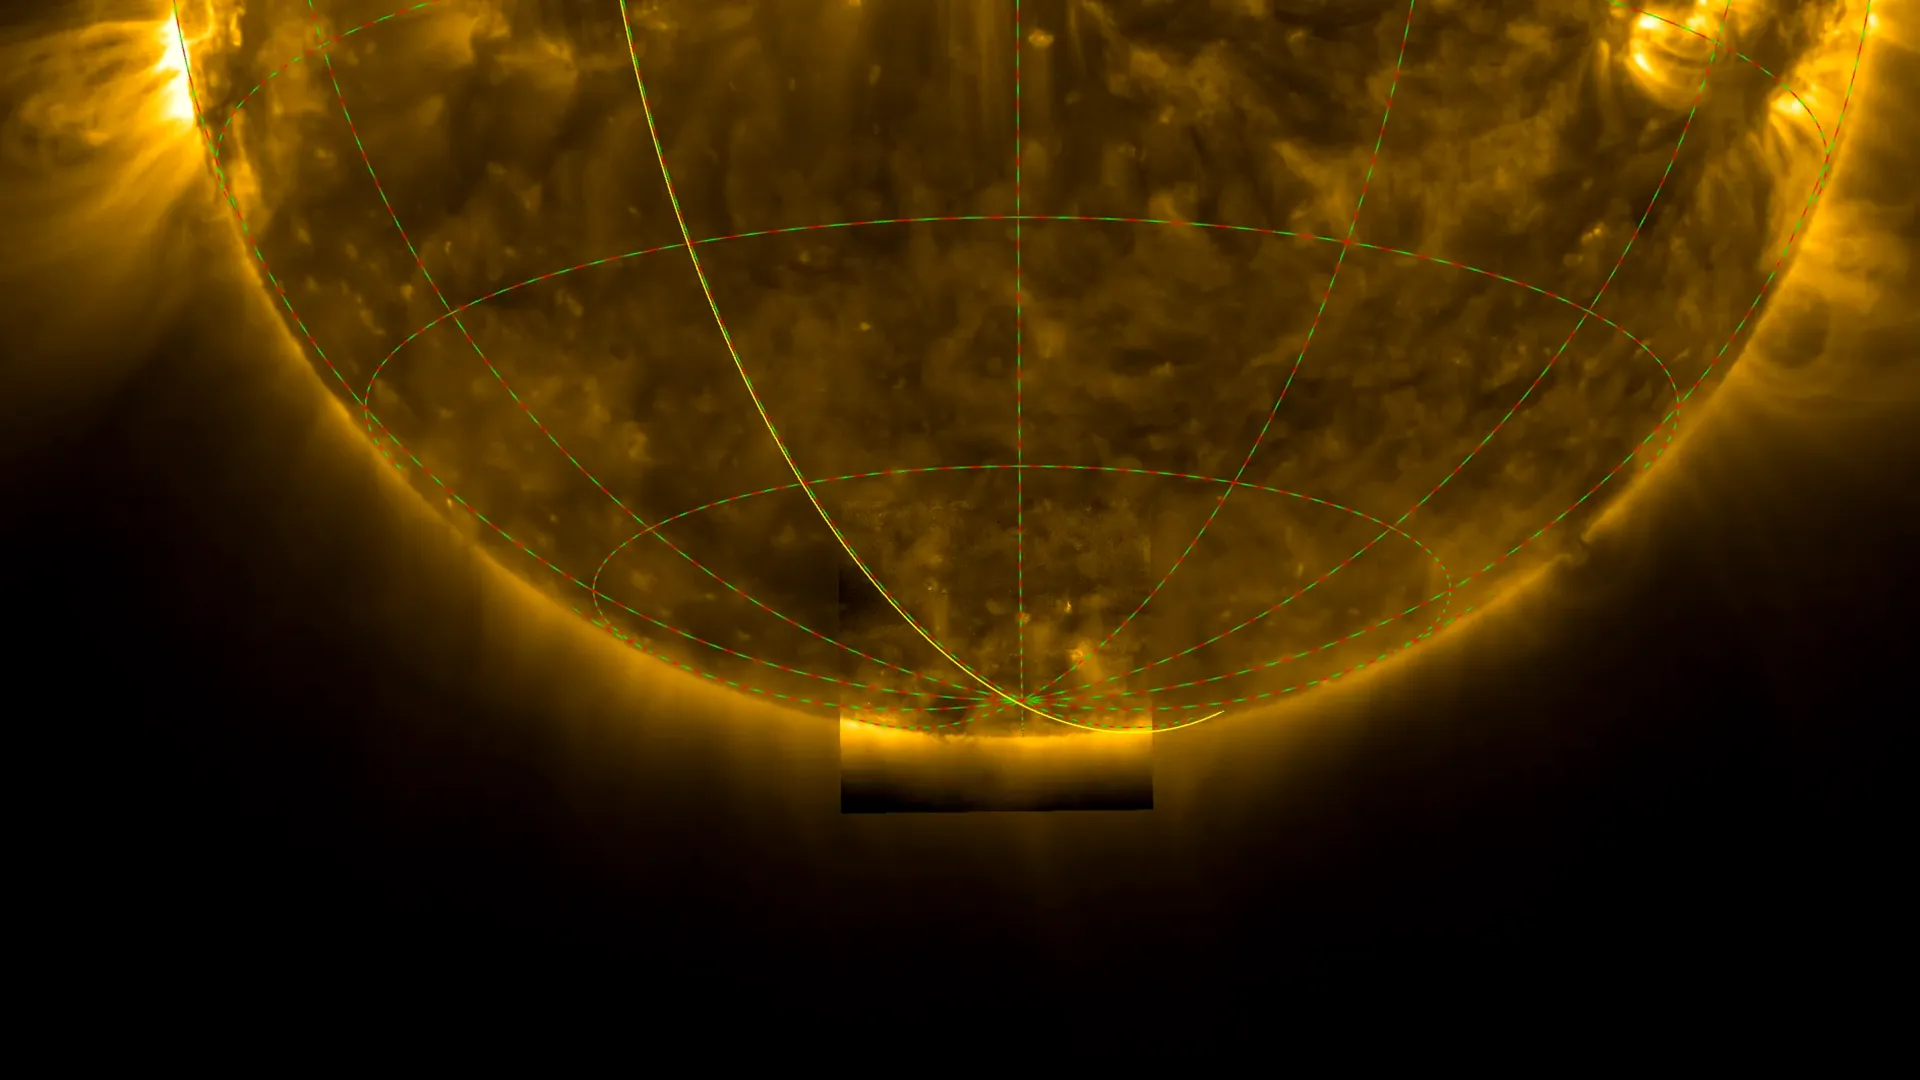
Thanks to its newly tilted orbit around the Sun, the European Space Agency-led Solar Orbiter spacecraft is the first to image the Sun’s poles from outside the ecliptic plane. Solar Orbiter’s unique viewing angle will change our understanding of the Sun’s magnetic field, the solar cycle and the workings of space weather.

Any image you have ever seen of the Sun was taken from around the Sun’s equator. This is because Earth, the other planets, and all other modern spacecraft orbit the Sun within a flat disc around the Sun called the ecliptic plane. By tilting its orbit out of this plane, Solar Orbiter reveals the Sun from a whole new angle.

The video titled ‘EUI video SolarOrbiter Sun south pole’ compares Solar Orbiter’s view (in yellow) with the one from Earth (grey), on 23 March 2025. At the time, Solar Orbiter was viewing the Sun from an angle of 17° below the solar equator, enough to directly see the Sun’s south pole. Over the coming years, the spacecraft will tilt its orbit even further, so the best views are yet to come.

“Today we reveal humankind’s first-ever views of the Sun’s pole” says Prof. Carole Mundell, ESA’s Director of Science. “The Sun is our nearest star, giver of life and potential disruptor of modern space and ground power systems, so it is imperative that we understand how it works and learn to predict its behaviour. These new unique views from our Solar Orbiter mission are the beginning of a new era of solar science.”

All eyes on the Sun’s south pole

A collage shows the Sun’s south pole as recorded on March 16-17, 2025, when Solar Orbiter was viewing the Sun from an angle of 15° below the solar equator. This was the mission’s first high-angle observation campaign, a few days before reaching its current maximum viewing angle of 17°.

The images shown in the collage were taken by three of Solar Orbiter’s scientific instruments: the Polarimetric and Helioseismic Imager (PHI), the Extreme Ultraviolet Imager (EUI), and the Spectral Imaging of the Coronal Environment (SPICE) instrument. Click on the image to zoom in and see video versions of the data.

“We didn’t know what exactly to expect from these first observations – the Sun’s poles are literally terra incognita,” says Prof. Sami Solanki, who leads the PHI instrument team from the Max Planck Institute for Solar System Research (MPS) in Germany.

The instruments each observe the Sun in a different way. PHI images the Sun in visible light (top left of the collage) and maps the Sun’s surface magnetic field (top centre). EUI images the Sun in ultraviolet light (top right), revealing the million-degree charged gas in the Sun’s outer atmosphere, the corona. The SPICE instrument (bottom row) captures light coming from different temperatures of charged gas above the Sun’s surface, thereby revealing different layers of the Sun’s atmosphere.

By comparing and analysing the complementary observations made by these three imaging instruments, we can learn about how material moves in the Sun’s outer layers. This may reveal unexpected patterns, such as polar vortices (swirling gas) similar to those seen around the poles of Venus and Saturn.

These groundbreaking new observations are also key to understanding the Sun’s magnetic field and why it flips roughly every 11 years, coinciding with a peak in solar activity. Current models and predictions of the 11-year solar cycle fall short of being able to predict exactly when and how powerfully the Sun will reach its most active state.

Messy magnetism at solar maximum

One of the first scientific findings from Solar Orbiter’s polar observations is the discovery that at the south pole, the Sun’s magnetic field is currently a mess. While a normal magnet has a clear north and south pole, the PHI instrument’s magnetic field measurements show that both north and south polarity magnetic fields are present at the Sun’s south pole.

This happens only for a short time during each solar cycle, at solar maximum, when the Sun’s magnetic field flips and is at its most active. After the field flip, a single polarity should slowly build up and take over the Sun’s poles. In 5-6 years from now, the Sun will reach its next solar minimum, during which its magnetic field is at its most orderly and the Sun displays its lowest levels of activity.

“How exactly this build-up occurs is still not fully understood, so Solar Orbiter has reached high latitudes at just the right time to follow the whole process from its unique and advantageous perspective,” notes Sami.

PHI’s view of the full Sun’s magnetic field puts these measurements in context (see ‘PHI_south-pole-Bmap’ and ‘PHI_global-Bmap_20250211-20250429’). The darker the colour (red/blue), the stronger the magnetic field is along the line of sight from Solar Orbiter to the Sun.

The strongest magnetic fields are found in two bands either side of the Sun’s equator. The dark red and dark blue regions highlight active regions, where magnetic field gets concentrated in sunspots on the Sun’s surface (photosphere).

Meanwhile, both the Sun’s south and north poles are speckled with red and blue patches. This demonstrates that at small scales, the Sun’s magnetic field has a complex and ever-changing structure.

SPICE measures movement for the first time

Another interesting ‘first’ for Solar Orbiter comes from the SPICE instrument. Being an imaging spectrograph, SPICE measures the light (spectral lines) sent out by specific chemical elements – among which hydrogen, carbon, oxygen, neon and magnesium – at known temperatures. For the last five years, SPICE has used this to reveal what happens in different layers above the Sun’s surface.

Now for the first time, the SPICE team has also managed to use precise tracking of spectral lines to measure how fast clumps of solar material are moving. This is known as a ‘Doppler measurement’, named after the same effect that makes passing ambulance sirens change pitch as they drive by.

The resulting velocity map reveals how solar material moves within a specific layer of the Sun. By comparing the SPICE doppler and intensity maps, you can directly compare the location and movement of particles (carbon ions) in a thin layer called the ‘transition region’, where the Sun’s temperature rapidly increases from 10 000 °C to hundreds of thousands of degrees.

The SPICE intensity map reveals the locations of clumps of carbon ions. The SPICE doppler map includes the blue and red colours to indicate how fast the carbon ions are moving towards and away from the Solar Orbiter spacecraft, respectively. Darker blue and red patches are related to material flowing faster due to small plumes or jets.

Crucially, Doppler measurements can reveal how particles are flung out from the Sun in the form of solar wind. Uncovering how the Sun produces solar wind is one of Solar Orbiter’s key scientific goals.

“Doppler measurements of solar wind setting off from the Sun by current and past space missions have been hampered by the grazing view of the solar poles. Measurements from high latitudes, now possible with Solar Orbiter, will be a revolution in solar physics,” says SPICE team leader, Frédéric Auchère from the University of Paris-Saclay (France).

The best is yet to come

These are just the first observations made by Solar Orbiter from its newly inclined orbit, and much of this first set of data still awaits further analysis. The complete dataset of Solar Orbiter’s first full ‘pole-to-pole’ flight past the Sun is expected to arrive on Earth by October 2025. All ten of Solar Orbiter’s scientific instruments will collect unprecedented data in the years to come.

“This is just the first step of Solar Orbiter’s ‘stairway to heaven’: in the coming years, the spacecraft will climb further out of the ecliptic plane for ever better views of the Sun’s polar regions. These data will transform our understanding of the Sun’s magnetic field, the solar wind, and solar activity,” notes Daniel Müller, ESA’s Solar Orbiter project scientist.

Notes for editors

Solar Orbiter is the most complex scientific laboratory ever to study our life-giving star, taking images of the Sun from closer than any spacecraft before and being the first to look at its polar regions.

In February 2025, Solar Orbiter officially began the ‘high latitude’ part of its journey around the Sun by tilting its orbit to an angle of 17° with respect to the Sun’s equator. In contrast, the planets and all other Sun-observing spacecraft orbit in the ecliptic plane, tilted at most 7° from the solar equator.

The only exception to this is the ESA/NASA Ulysses mission (1990-2009), which flew over the Sun’s poles but did not carry any imaging instruments. Solar Orbiter’s observations will complement Ulysses’ by observing the poles for the first time with telescopes, in addition to a full suite of in-situ sensors, while flying much closer to the Sun. Additionally, Solar Orbiter will monitor changes at the poles throughout the solar cycle.

Solar Orbiter will continue to orbit around the Sun at this tilt angle until 24 December 2026, when its next flight past Venus will tilt its orbit to 24°. From 10 June 2029, the spacecraft will orbit the Sun at an angle of 33°. (Overview of Solar Orbiter’s journey around the Sun.)

Solar Orbiter is a space mission of international collaboration between ESA and NASA, operated by ESA. Solar Orbiter’s Polarimetric and Helioseismic Imager (PHI) instrument is led by the Max Planck Institute for Solar System Research (MPS), Germany. The Extreme Ultraviolet Imager (EUI) instrument is led by the Royal Observatory of Belgium (ROB). The Spectral Imaging of the Coronal Environment (SPICE) instrument is a European-led facility instrument, led by the Institut d’Astrophysique Spatiale (IAS) in Paris, France.


Share Button

Your brain has a hidden beat — and smarter minds sync to it

When the brain is under pressure, certain neural signals begin to move in sync – much like a well-rehearsed orchestra. A new study from Johannes Gutenberg University Mainz (JGU) is the first to show how flexibly this neural synchrony adjusts to different situations and that this dynamic coordination is closely linked to cognitive abilities. “Specific signals in the midfrontal brain region are better synchronized in people with higher cognitive ability – especially during demanding phases of reasoning,” explained Professor Anna-Lena Schubert from JGU’s Institute of Psychology, lead author of the study recently published in the Journal of Experimental Psychology: General.

The researchers focused on the midfrontal area of the brain and the measurable coordination of the so-called theta waves. These brainwaves oscillate between four and eight hertz and belong to the group of slower neural frequencies. “They tend to appear when the brain is particularly challenged such as during focused thinking or when we need to consciously control our behavior,” said Schubert, who heads the Analysis and Modeling of Complex Data Lab at JGU.

Being able to focus even next to a buzzing phone

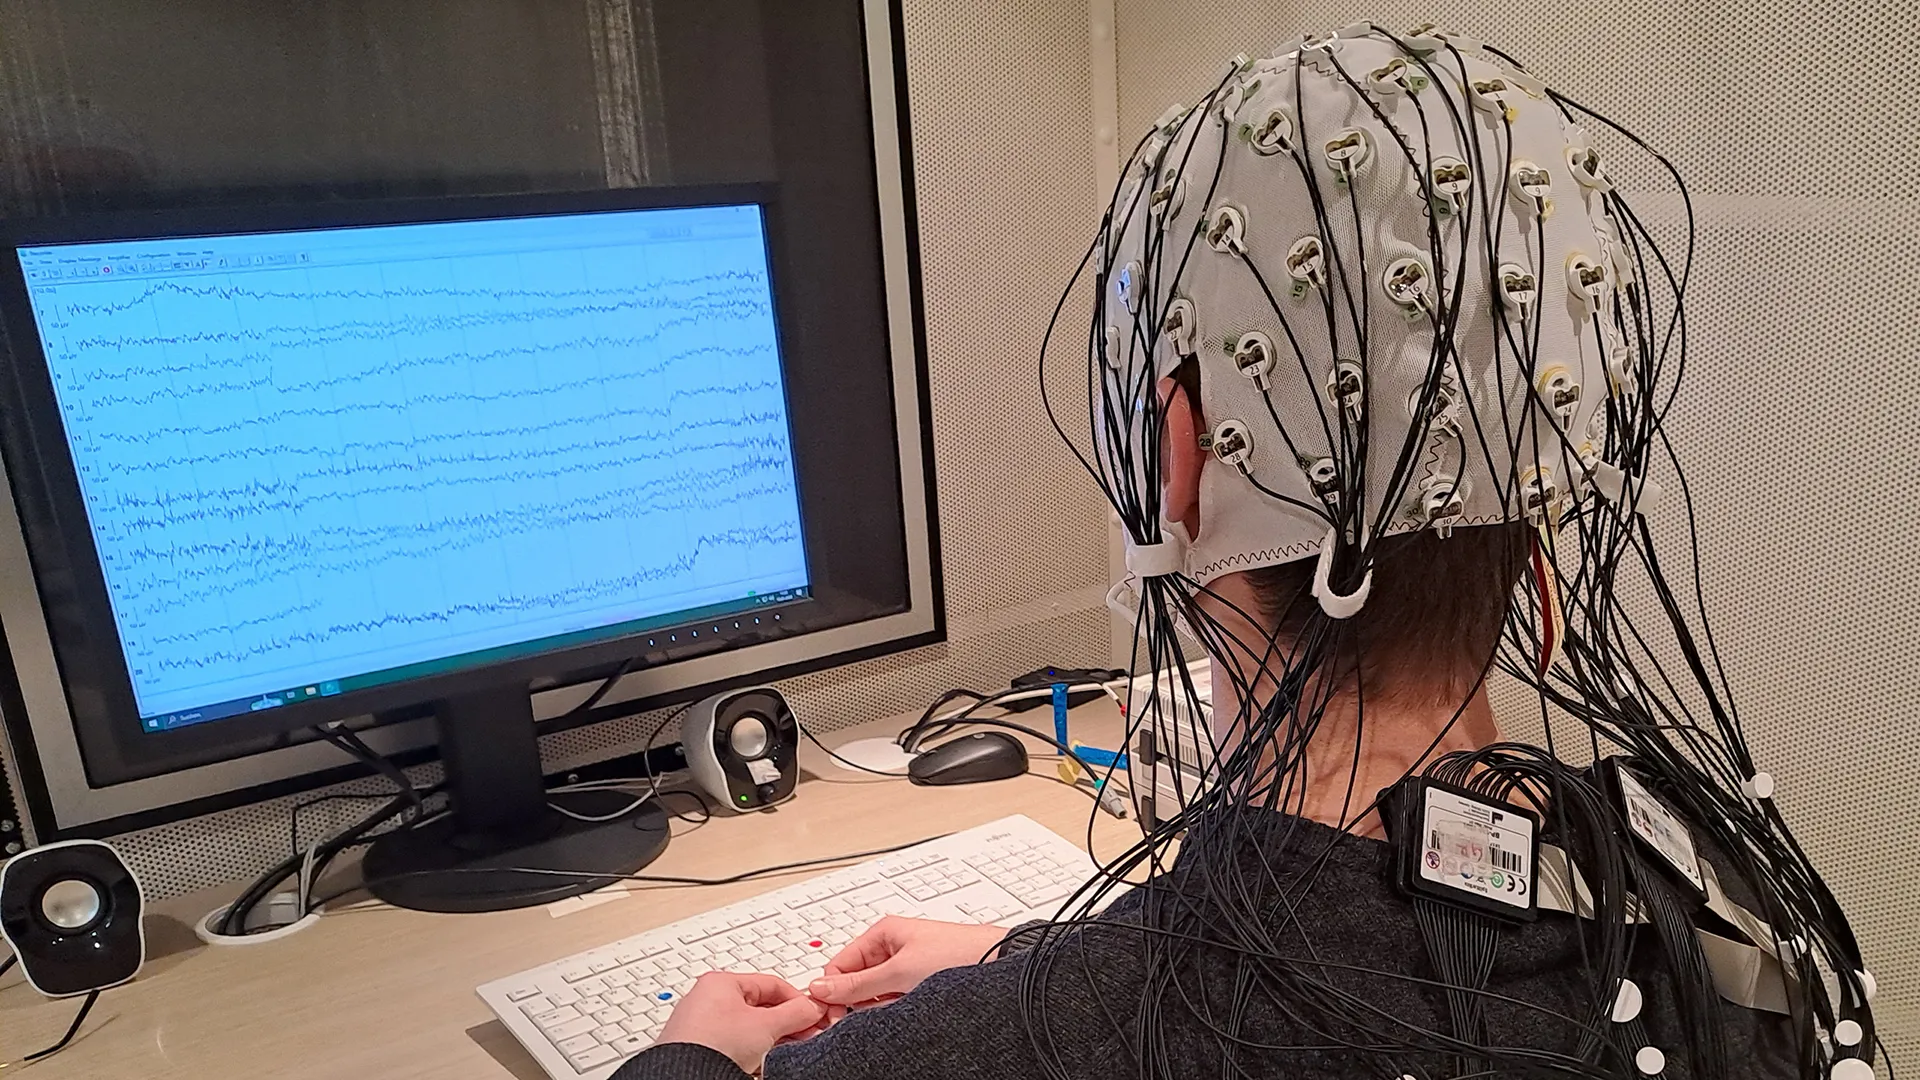
The 148 participants in the study, aged between 18 and 60, first completed tests assessing memory and intelligence before their brain activity was recorded using electroencephalography (EEG). This method measures tiny electrical signals in the brain using electrodes placed on the scalp and is a well-established technique for gaining precise insights into cognitive processes. During EEG recording, participants completed three mentally demanding tasks designed to assess cognitive control.

The researchers were interested in the participants’ ability to flexibly shift between changing rules, which is an essential aspect of intelligent information processing. For example, participants had to press a button to decide whether a number was even or odd, and moments later whether it was greater or less than five. Each switch of rules required rapid adjustment of mental strategies – a process that allowed researchers to closely observe how the brain’s networks coordinate in real time.

As a result, individuals with higher cognitive abilities showed especially strong synchronization of theta waves during crucial moments, particularly when making decisions. Their brains were better at sustaining purposeful thought when it mattered most. “People with stronger midfrontal theta connectivity are often better at maintaining focus and tuning out distractions, be it that your phone buzzes while you’re working or that you intend to read a book in a busy train station,” explained Schubert.

A flexible rhythm in the brain

Professor Anna-Lena Schubert was particularly surprised by how closely this brain rhythm coordination was tied to cognitive abilities. “We did not expect the relationship to be this clear,” she said. What mattered most was not continuous synchronization, but the brain’s ability to adapt its timing flexibly and contextually – like an orchestra that follows a skilled conductor. The midfrontal region often sets the tone in this coordination but works in concert with other areas across the brain. This midfrontal theta connectivity appears to be particularly relevant during the execution of decisions, however not during the preparatory mental adjustment to new task rules.

Previous EEG studies on cognitive ability mostly examined activity in isolated brain regions. In contrast, this study took a network-level approach, examining how different areas interact across multiple tasks to identify stable, overarching patterns. The findings show that individual differences in cognitive ability are linked to the brain’s dynamic network behavior.

“Potential applications such as brain-based training tools or diagnostics are still a long way off,” emphasized Schubert. “But our study offers important groundwork for understanding how intelligence functions at a neural level.” A follow-up study, now seeking participants aged 40 and older from the Rhine-Main region, will explore which biological and cognitive factors further support this kind of efficient brain coordination and the role of additional cognitive abilities, such as processing speed and working memory.

Share Button

‘My cancer was dismissed as a pulled muscle’

Former footballer Mel Tottoh was diagnosed with myeloma after months of rib and back pain.

Share Button

Cervical screening changes set to start in Jersey

New testing methods which are more accurate than previous tests lead to the changes.

Share Button