New type of entanglement lets scientists ‘see’ inside nuclei

Nuclear physicists have found a new way to use the Relativistic Heavy Ion Collider (RHIC) — a particle collider at the U.S. Department of Energy’s (DOE) Brookhaven National Laboratory — to see the shape and details inside atomic nuclei. The method relies on particles of light that surround gold ions as they speed around the collider and a new type of quantum entanglement that’s never been seen before.

Through a series of quantum fluctuations, the particles of light (a.k.a. photons) interact with gluons — gluelike particles that hold quarks together within the protons and neutrons of nuclei. Those interactions produce an intermediate particle that quickly decays into two differently charged “pions” (π). By measuring the velocity and angles at which these π+ and π– particles strike RHIC’s STAR detector, the scientists can backtrack to get crucial information about the photon — and use that to map out the arrangement of gluons within the nucleus with higher precision than ever before.

“This technique is similar to the way doctors use positron emission tomography (PET scans) to see what’s happening inside the brain and other body parts,” said former Brookhaven Lab physicist James Daniel Brandenburg, a member of the STAR collaboration who joined The Ohio State University as an assistant professor in January 2023. “But in this case, we’re talking about mapping out features on the scale of femtometers — quadrillionths of a meter — the size of an individual proton.”

Even more amazing, the STAR physicists say, is the observation of an entirely new kind of quantum interference that makes their measurements possible.

“We measure two outgoing particles and clearly their charges are different — they are different particles — but we see interference patterns that indicate these particles are entangled, or in sync with one another, even though they are distinguishable particles,” said Brookhaven physicist and STAR collaborator Zhangbu Xu.

That discovery may have applications well beyond the lofty goal of mapping out the building blocks of matter.

For example, many scientists, including those awarded the 2022 Nobel Prize in Physics, are seeking to harness entanglement — a kind of “awareness” and interaction of physically separated particles. One goal is to create significantly more powerful communication tools and computers than exist today. But most other observations of entanglement to date, including a recent demonstration of interference of lasers with different wavelengths, have been between photons or identical electrons.

“This is the first-ever experimental observation of entanglement between dissimilar particles,” Brandenburg said.

The work is described in a paper just published in Science Advances.

Shining a light on gluons

RHIC operates as a DOE Office of Science user facility where physicists can study the innermost building blocks of nuclear matter — the quarks and gluons that make up protons and neutrons. They do this by smashing together the nuclei of heavy atoms such as gold traveling in opposite directions around the collider at close to the speed of light. The intensity of these collisions between nuclei (also called ions) can “melt” the boundaries between individual protons and neutrons so scientists can study the quarks and gluons as they existed in the very early universe — before protons and neutrons formed.

But nuclear physicists also want to know how quarks and gluons behave within atomic nuclei as they exist today — to better understand the force that holds these building blocks together.

A recent discovery using “clouds” of photons that surround RHIC’s speeding ions suggests a way to use these particles of light to get a glimpse inside the nuclei. If two gold ions pass one another very closely without colliding, the photons surrounding one ion can probe the internal structure of the other.

“In that earlier work, we demonstrated that those photons are polarized, with their electric field radiating outward from the center of the ion. And now we use that tool, the polarized light, to effectively image the nuclei at high energy,” Xu said.

The quantum interference observed between the π+ and π– in the newly analyzed data makes it possible to measure the photons’ polarization direction very precisely. That in turn lets physicists look at the gluon distribution both along the direction of the photon’s motion and perpendicular to it.

That two-dimensional imaging turns out to be very important.

“All past measurements, where we didn’t know the polarization direction, measured the density of gluons as an average — as a function of the distance from the center of the nucleus,” Brandenburg said. “That’s a one-dimensional image.”

Those measurements all came out making the nucleus look too big when compared with what was predicted by theoretical models and measurements of the distribution of charge in the nucleus.

“With this 2D imaging technique, we were able to solve the 20-year mystery of why this happens,” Brandenburg said.

The new measurements show that the momentum and energy of the photons themselves gets convoluted with that of the gluons. Measuring just along the photon’s direction (or not knowing what that direction is) results in a picture distorted by these photon effects. But measuring in the transverse direction avoids the photon blurring.

“Now we can take a picture where we can really distinguish the density of gluons at a given angle and radius,” Brandenburg said. “The images are so precise that we can even start to see the difference between where the protons are and where the neutrons are laid out inside these big nuclei.”

The new pictures match up qualitatively with the theoretical predictions using gluon distribution, as well as the measurements of electric charge distribution within the nuclei, the scientists say.

Details of the measurements

To understand how the physicists make these 2D measurements, let’s step back to the particle generated by the photon-gluon interaction. It’s called a rho, and it decays very quickly — in less than four septillionths of a second — into the π+ and π–. The sum of the momenta of those two pions gives physicists the momentum of the parent rho particle — and information that includes the gluon distribution and the photon blurring effect.

To extract just the gluon distribution, the scientists measure the angle between the path of either the π+ or π– and the rho’s trajectory. The closer that angle is to 90 degrees, the less blurring you get from the photon probe. By tracking pions that come from rho particles moving at a range of angles and energies, the scientists can map out the gluon distribution across the entire nucleus.

Now for the quantum quirkiness that makes the measurements possible — the evidence that the π+ and π– particles striking the STAR detector result from interference patterns produced by the entanglement of these two dissimilar oppositely charged particles.

Keep in mind that all the particles we are talking about exist not just as physical objects but also as waves. Like ripples on the surface of a pond radiating outward when they strike a rock, the mathematical “wavefunctions” that describe the crests and troughs of particle waves can interfere to reinforce or cancel one another out.

When the photons surrounding two near-miss speeding ions interact with gluons inside the nuclei, it’s as if those interactions actually generate two rho particles, one in each nucleus. As each rho decays into a π+ and π–, the wavefunction of the negative pion from one rho decay interferes with the wavefunction of the negative pion from the other. When the reinforced wavefunction strikes the STAR detector, the detector sees one π–. The same thing happens with the wavefunctions of the two positively charged pions, and the detector sees one π+.

“The interference is between two wavefunctions of the identical particles, but without the entanglement between the two dissimilar particles — the π+ and π– — this interference would not materialize,” said Wangmei Zha, a STAR collaborator at the University of Science and Technology of China, and one of the original proponents of this explanation. “This is the weirdness of quantum mechanics!”

Could the rhos simply be entangled? The scientists say no. The rho particle wavefunctions originate at a distance 20 times the distance they could travel within their short lifetime, so they cannot interact with each other before they decay to π+ and π–. But the wavefunctions of the π+ and π– from each rho decay retain the quantum information of their parent particles; their crests and troughs are in phase, “aware of each other,” despite striking the detector meters apart.

“If the π+ and π– were not entangled, the two π+ (or π–) wavefunctions would have a random phase, without any detectable interference effect,” said Chi Yang, a STAR collaborator from Shandong University in China, who also helped lead the analysis for this result. “We wouldn’t see any orientation related to the photon polarization — or be able to make these precision measurements.”

Future measurements at RHIC with heavier particles and different lifetimes — and at an Electron-Ion Collider (EIC) being built at Brookhaven — will probe more detailed distributions of gluons inside nuclei and test other possible quantum interference scenarios.

This work was funded by the DOE Office of Science, the U.S. National Science Foundation, and a range of international agencies spelled out in the published paper. The STAR team used computational resources at the RHIC and ATLAS Computing Facility/Scientific Data and Computing Center at Brookhaven Lab, the National Energy Research Scientific Computing Center (NERSC) — a DOE Office of Science user facility at Lawrence Berkeley National Laboratory — and the Open Science Grid consortium.


Share Button

Climate warming reduces organic carbon burial beneath oceans

An international team of scientists painstakingly gathered data from more than 50 years of seagoing scientific drilling missions to conduct a first-of-its-kind study of organic carbon that falls to the bottom of the ocean and gets drawn deep inside the planet.

Their study, published this week in Nature, suggests climate warming could reduce organic carbon burial and increase the amount of carbon that’s returned to the atmosphere, because warmer ocean temperatures could increase the metabolic rates of bacteria.

Researchers from Rice University, Texas A&M University, the University of Leeds and the University of Bremen analyzed data from drilled cores of muddy seafloor sediments that were gathered during 81 of the more than 1,500 shipboard expeditions mounted by the International Ocean Discovery Program (IODP) and its predecessors. Their study provides the most detailed accounting to date of organic carbon burial over the past 30 million years, and it suggests scientists have much to learn about the dynamics of Earth’s long-term carbon cycle.

“What we’re finding is that burial of organic carbon is very active,” said study co-author Mark Torres of Rice. “It changes a lot, and it responds to the Earth’s climatic system much more than scientists previously thought.”

The paper’s corresponding author, Texas A&M oceanographer Yige Zhang, said, “If our new records turn out to be right, then they’re going to change a lot of our understanding about the organic carbon cycle. As we warm up the ocean, it will make it harder for organic carbon to find its way to be buried in the marine sediment system.”

Carbon is the main component of life, and carbon constantly cycles between Earth’s atmosphere and biosphere as plants and animals grow and decompose. Carbon can also cycle through the Earth on a journey that takes millions of years. It begins at tectonic subduction zones where the relatively thin tectonic plates atop oceans are dragged down below thicker plates that sit atop continents. Downward diving oceanic crust heats up as it sinks, and most of its carbon returns to the atmosphere as carbon dioxide (CO2) from volcanoes.

Scientists have long studied the amount of carbon that gets buried in ocean sediments. Drilled cores from the ocean floor contain layers of sediments laid down over tens of millions of years. Using radiometric dating and other methods, researchers can determine when specific sediments were laid down. Scientists can also learn a lot about past conditions on Earth by studying minerals and microscopic skeletons of organisms trapped in sediments.

“There are two isotopes of carbon — carbon-12 and carbon-13,” said Torres, an assistant professor in Rice’s Department of Earth, Environmental and Planetary Sciences. “The difference is just one neutron. So carbon-13 is just a bit heavier.

“But life is lazy, and if something’s heavier — even that tiny bit — it’s harder to move,” Torres said. “So life prefers the lighter isotope, carbon-12. And if you grow a plant and give it CO2, it will actually preferentially take up the lighter isotope. That means the ratio of carbon-13 to -12 in the plant is going to be lower — contain less 13 — than in the CO2 you fed the plant.”

For decades scientists have used isotopic ratios to study the relative amounts of inorganic and organic carbon that was undergoing burial at specific points in Earth’s history. Based on those studies and computational models, Torres said scientists have largely believed the amount of carbon undergoing burial had changed very little over the past 30 million years.

Zhang said, “We had this idea of using the actual data and calculating their organic carbon burial rates to come up with the global carbon burial. We wanted to see if this ‘bottom-up’ method agreed with the traditional method of isotopic calculations, which is more ‘top down.'”

The job of compiling data from IODP expeditions fell to study first author, Ziye Li of Bremen, who was then a visiting student in Zhang’s lab at A&M.

Zhang said the study findings were shocking.

“Our new results are very different — they’re the opposite of what the isotope calculations are suggesting,” he said.

Zhang said this is particularly the case during a period called the mid-Miocene, about 15 million years ago. Conventional scientific wisdom held that a large amount of organic carbon was buried around this interval, exemplified by the organic-rich “Monterey Formation” in California. The team’s findings suggest instead that the smallest amount of organic carbon was buried during this interval over the last 23 million years or so.

He described the team’s paper as the beginning of a potentially impactful new way to analyze data that may aid in understanding and addressing climate change.

“It’s people’s curiosity, but I also want to make it more informative about what’s going to happen in the future,” Zhang said. “We’re doing several things quite creatively to really use paleo data to inform us about the present and future.”

The research was supported by the American Chemical Society’s Petroleum Research Fund (59797-DNI2). On behalf of the National Science Foundation, Texas A&M has served as the science operator of the IODP drill ship JOIDES Resolution for the past 36 years as part of the largest federal research grant currently managed by the university.

Share Button

Hubble finds that ghost light among galaxies stretches far back in time

In giant clusters of hundreds or thousands of galaxies, innumerable stars wander among the galaxies like lost souls, emitting a ghostly haze of light. These stars are not gravitationally tied to any one galaxy in a cluster.

The nagging question for astronomers has been: how did the stars get so scattered throughout the cluster in the first place? Several competing theories include the possibility that the stars were stripped out of a cluster’s galaxies, or they were tossed around after mergers of galaxies, or they were present early in a cluster’s formative years many billions of years ago.

A recent infrared survey from NASA’s Hubble Space Telescope, which looked for this so-called “intracluster light,” sheds new light on the mystery. The new Hubble observations suggest that these stars have been wandering around for billions of years, and are not a product of more recent dynamical activity inside a galaxy cluster that would strip them out of normal galaxies.

The survey included 10 galaxy clusters as far away as nearly 10 billion light-years. These measurements must be made from space because the faint intracluster light is 10,000 times dimmer than the night sky as seen from the ground.

The survey reveals that the fraction of the intracluster light relative to the total light in the cluster remains constant, looking over billions of years back into time. “This means that these stars were already homeless in the early stages of the cluster’s formation,” said James Jee of Yonsei University in Seoul, South Korea. His results are being published in the January 5 issue of Nature magazine.

Stars can be scattered outside of their galactic birthplace when a galaxy moves through gaseous material in the space between galaxies, as it orbits the center of the cluster. In the process, drag pushes gas and dust out of the galaxy. However, based on the new Hubble survey, Jee rules out this mechanism as the primary cause for the intracluster star production. That’s because the intracluster light fraction would increase over time to the present if stripping is the main player. But that is not the case in the new Hubble data, which show a constant fraction over billions of years.

“We don’t exactly know what made them homeless. Current theories cannot explain our results, but somehow they were produced in large quantities in the early universe,” said Jee. “In their early formative years, galaxies might have been pretty small and they bled stars pretty easily because of a weaker gravitational grasp.”

“If we figure out the origin of intracluster stars, it will help us understand the assembly history of an entire galaxy cluster, and they can serve as visible tracers of dark matter enveloping the cluster,” said Hyungjin Joo of Yonsei University, the first author of the paper. Dark matter is the invisible scaffolding of the universe, which holds galaxies, and clusters of galaxies, together.

If the wandering stars were produced through a comparatively recent pinball game among galaxies, they would not have enough time to scatter throughout the entire gravitational field of the cluster and therefore would not trace the distribution of the cluster’s dark matter. But if the stars were born in the cluster’s early years, they will have fully dispersed throughout the cluster. This would allow astronomers to use the wayward stars to map out the dark matter distribution across the cluster.

This technique is new and complementary to the traditional method of dark matter mapping by measuring how the entire cluster warps light from background objects due to a phenomenon called gravitational lensing.

Intracluster light was first detected in the Coma cluster of galaxies in 1951 by Fritz Zwicky, who reported that one of his most interesting discoveries was observing luminous, faint intergalactic matter in the cluster. Because the Coma cluster, containing at least 1,000 galaxies, is one of the nearest clusters to Earth (330 million light-years), Zwicky was able to detect the ghost light even with a modest 18-inch telescope.

NASA’s James Webb Space Telescope’s near-infrared capability and sensitivity will greatly extend the search for intracluster stars deeper into the universe, and therefore should help solve the mystery.

Share Button

What is known about new Covid variant XBB.1.5?

The latest Omicron variant is making scientists take notice in the US – so what do you need to know?

Share Button

NHS: Inside a GP surgery as winter pressure mounts

This week surgeries across the country likely face intense demand after the Christmas break.

Share Button

Installing Acoustic Panels

One project that I’ve been wanting to do for a while was to add acoustic panels to my home studio and office. Acoustic panels absorb sound, so they can greatly help to reduce room echo. Some rooms in my house are very echoey, which can be noticeable when doing recordings or live calls in an untreated room.

Previously my studio was ringed with several sound blankets (80 inches square) hanging on light stands. That was acoustically effective but rather ugly, and I didn’t like that the blankets blocked the windows too. I used the sound blankets for a few years to good effect though.

There are many YouTube videos sharing how to make your own acoustic panels on the cheap. I might have gone that route if I only needed a few panels, but I wanted more than 20 panels, and I thought I’d find the DYI approach really tedious after a while if I had to manually make that many panels. I also felt that it would add too many extra decisions to the process and slow me down a lot. I’d have to decide which wood to buy, which fabric to use, which acoustic material to put inside, and where to source these items. I also don’t own an electric saw or a stapler that can secure fabric to work, so I’d have to invest in additional tools as well. That all seemed like I’d be biting off more than I wanted to chew. This was a case where I’d rather spend more money to save time.

So I concluded that it would be way easier and less risky to buy professionally made panels. I still wanted a little bit of the DIY experience though, so I opted to install them myself, which was still a considerable amount of work.

Good acoustic panels are about 3x as effective at absorbing sound reflections as sound blankets, so you don’t need to cover as much wall area with the panels. It’s generally undesirable to have too much coverage. You want to retain some reflections, so the room doesn’t sound completely dead. A common recommendation I’ve seen is to cover at least 25-30% of wall area with panels.

My rooms also have carpeting too, so I don’t need to worry as much about vertical reflections. Hence I didn’t intend to install any panels on the ceilings.

The considerations for acoustic panels are different if you’re recording music or if you’re using them for controlling the reflections of speakers, such as in a home theater setup. I’m only concerned about vocals for audio/video recordings and for live video calls, so I prioritized my panel and installation choices based on that.

I also wanted panels that would look nice aesthetically. I wanted to appreciate the look of the panels when I’m in the rooms where they’re installed. That’s one reason I didn’t go with the cheaper foam panels. Foam panels are much less effective acoustically too, especially if you get the thinner ones (like 1 inch thick).

Sourcing the Panels

After researching various options, I decided to order all of the panels from Acoustimac. (I’m not an affiliate, and I have no sponsorship relationship with them.) I went with them after seeing some positive reviews and recommendations online. I feel that was a good choice, but since this is my first time using acoustic panels of any kind, I don’t really have anything to compare them to other than the sound blankets I was previously using.

I started by requesting fabric swatches, which they graciously sent for free. Their website provides an option to order the swatches for 1 penny plus about $8 shipping, but I didn’t notice that option till I’d already sent the request via the contact form. The swatches were very helpful in deciding which fabrics to go with. They have a lot of different color options, and the colors can look slightly different than the pics on their website.

I found that a good way to get a better price per panel was to take advantage of Acoustimac’s multi-panel packs instead of ordering them individually. They also let you customize the colors per panel. Even when I ordered an 8-pack where the order form invited me to specify two colors (4 of one color, 4 of another), I found out by contacting their support that I could get up to 8 different colors for the same price if I wanted. So that level of customization was really nice. In fact, overall I found their customer support to be excellent throughout the process. They even held up on shipping the panels when I asked them to (after I’d placed the order) because I realized they might arrive while I was out of town. I really appreciated that.

I ended up buying 8 of their 412 panels (4′ tall x 1′ wide x 2″ thick) and 16 of their 422 panels (4′ tall x 2′ wide x 2″ thick). You can mount the panels vertically or horizontally. I planned to mount most of them vertically. If you’re recording music, you might want to go with their thicker 4-inch panels, which are more effective at absorbing low bass sounds.

I also went with Acoustimac’s “eco” filling for the panels, which costs a bit more per panel. If you buy the panels individually, that option is $10 more per panel, but it can be as little as $3 per panel when you buy them in multi-packs.

Recording Studio

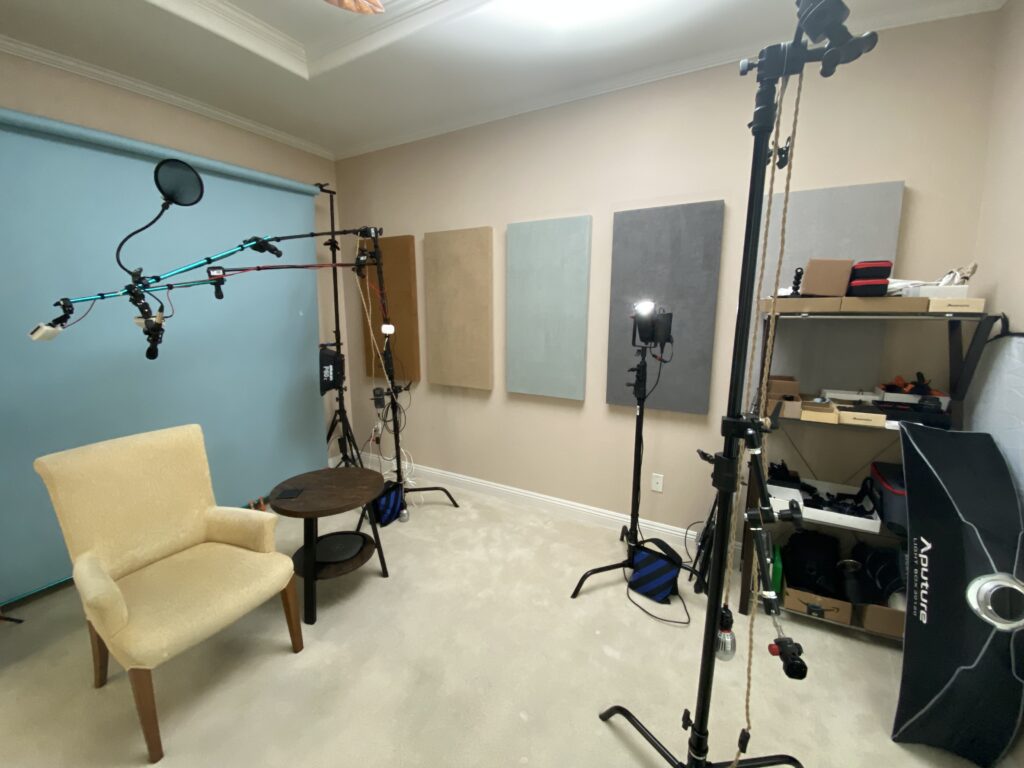
Here are some pics of the new acoustic panels I added to the studio. From left to right, the colors along this wall are rust, tan, spa, charcoal, gray. These are all 422 panels.

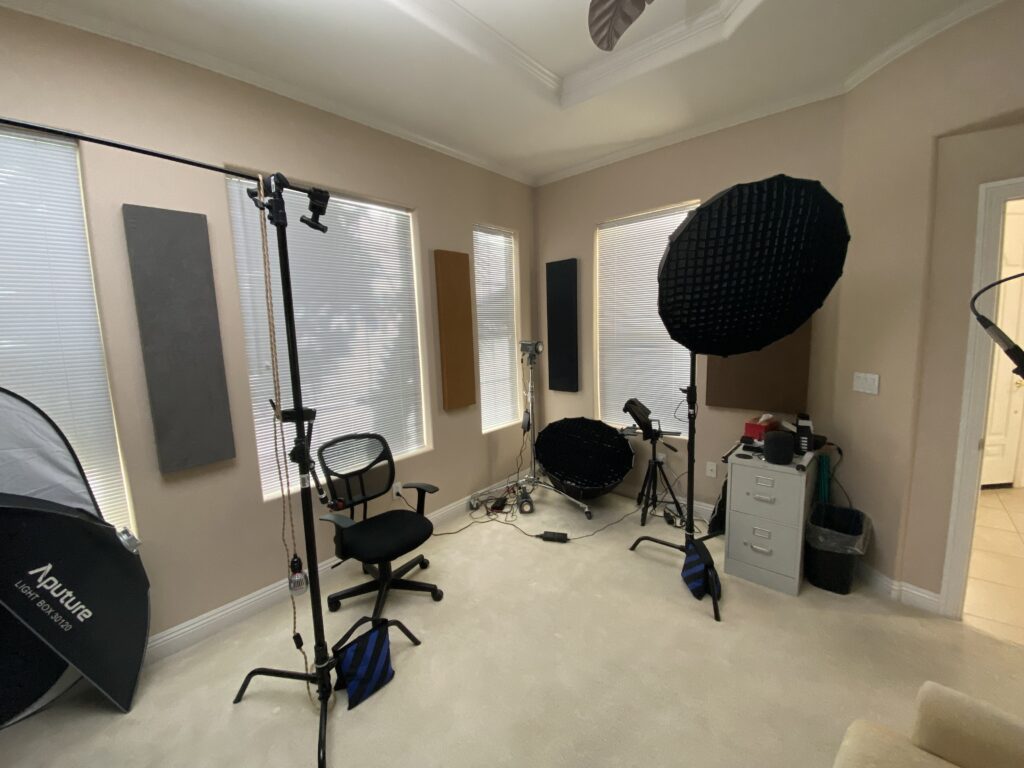
I put 3 of the 412 panels between the windows (charcoal, rust, black), and there’s another 422 panel (peat) behind the light with the light box on it.

Acoustic Panels

Another modest upgrade would be to add some extra storage to the studio. I have a small glass bookshelf and a little filing cabinet in the room, but I could use some small shelves or a cabinet or two for storing various gear. This room doesn’t have a closet. It’s a relatively small space for a studio (about 14′ square), but it works.

Office

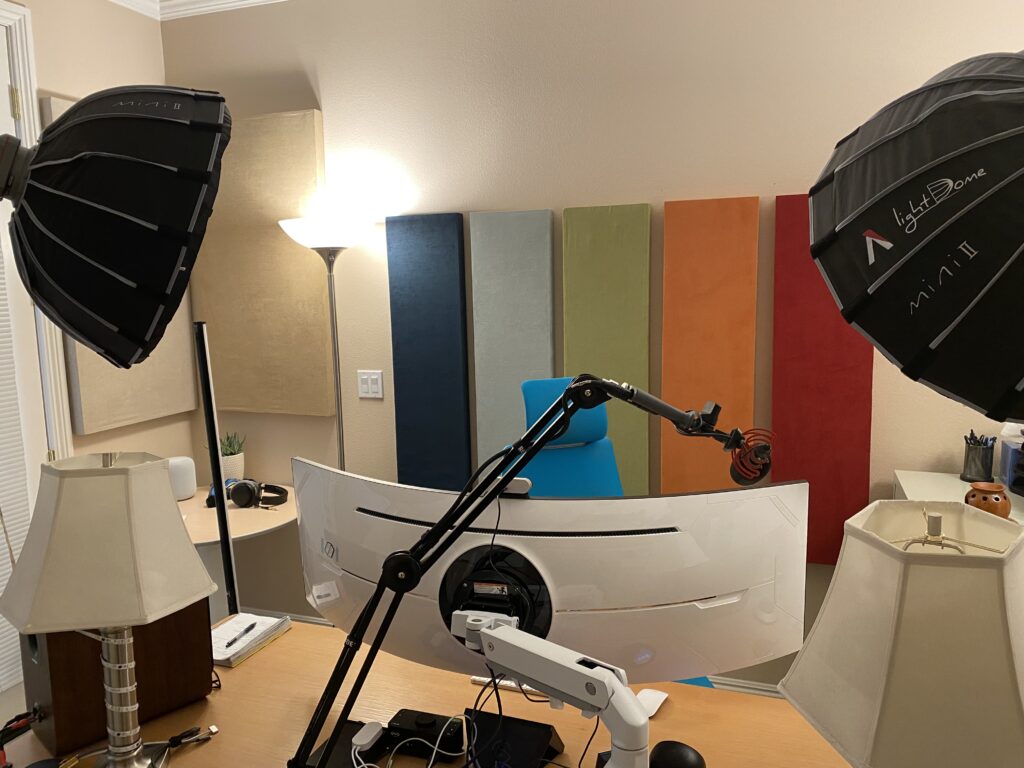
Here’s the home office. I put a couple of 422 panels in the corner (shell, tan). And I add 5 of the 412 panels behind the area where I do lots of Zoom calls (navy, spa, apple, tangerine, ruby). There are 5 more 422 panels on other walls of the room too, which aren’t shown (spa, shell, khaki, tan, gray).

How the panels look on camera is really sensitive to the lighting. The navy blue panel looks nearly black on camera if it isn’t getting much light, so I’ll use a 4′ tube light to splash some extra light on it when I’m live. The ruby red panel looks much brighter on camera. I’m using Amaran 100X’s with Light Dome Mini II soft boxes for my key and fill lights, which work nicely. I normally set the key to 15% and the fill at 7%, both at 5600K. I previously calibrated the lighting for a plain background where I mainly just had to focus on how to light myself, so I may need to re-calibrate the light settings for this different look.

I like how this looks on camera so far. It adds a bit of color, but I don’t think it’s overly distracting. We put the darker colors on the outside of the frame with the milder colors in the middle. With the framing on a Zoom call, you’ll only see about half of the navy and ruby panels, so the middle 3 panels are the most prevalent.

I also like that we can change the look a bit by splashing some colored light on the panels. I probably won’t do that for Zoom calls, but for recorded videos it can create some interesting looks.

Living Room

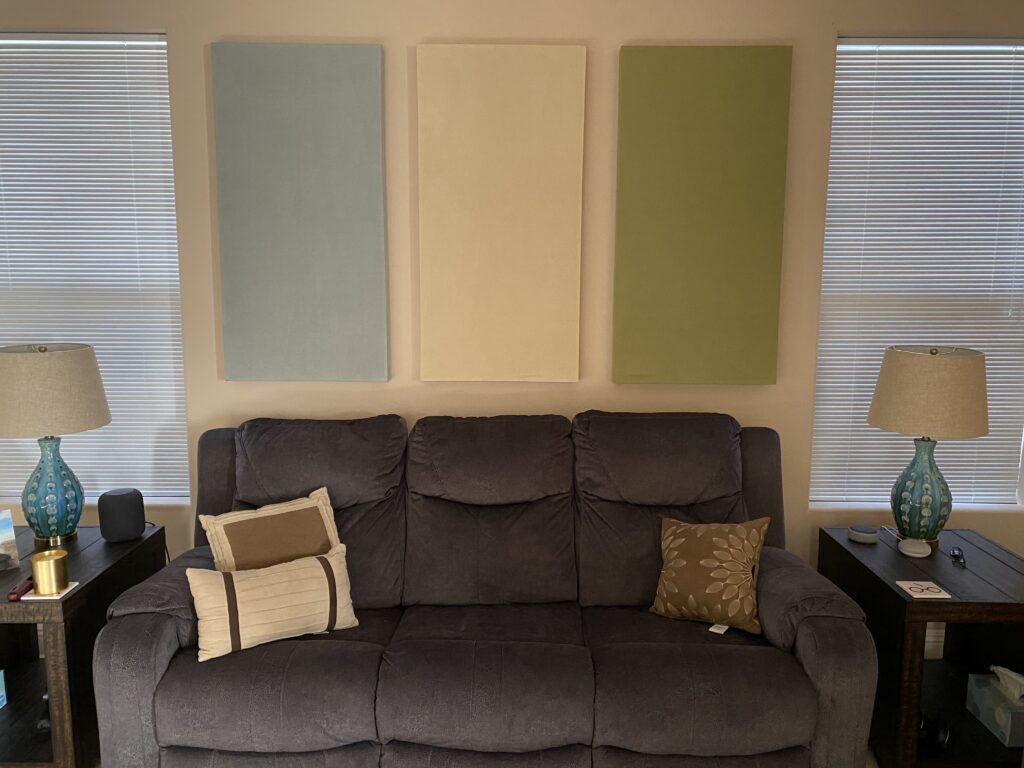
We added 3 panels to the living room too since I do some occasional filming there. Partly this was because we got a good deal buying the panels in 8-packs (24 total). We used 12 panels for the office and 9 for the studio, so we had 3 extra 422 panels to use for this room (spa, sunshine, apple).

Installation

It took me several hours to install the panels over the course of about 3 days since I carefully measured and calculated the exact positions for each one, having to balance aspects like acoustic effectiveness and symmetry.

The 412 panels weigh about 8 lbs each, and the 422 panels are about 15 pounds. The installation kit includes screws and metal brackets to hang the panels on the walls. I wondered if I’d need to use drywall anchors, but that turned out to be unnecessary. With 4 screws securing the brackets to the walls for each panel, they seem pretty secure in the drywall. If you have very weak or flaky drywall though, I might recommend using anchors, just to be safe.

One issue I had was getting the thinner 412 panels to hang straight. When hung vertically, the brackets are pretty close together, so even with careful measuring, I found it pretty difficult to install the brackets precisely enough to get the panel to be perfectly vertical when hanging. It would have been easier to get them to hang straight with a different mounting system, such as using picture hanging wire. Some of my 412 panels were a bit crooked when mounted, offset by 0.5″ or more horizontally from top to bottom. I found that if the difference was less than 0.25″, the panel will look sufficiently straight, but at 0.5″ or more, the crookedness becomes very noticeable.

My solution was to add a Command Strip to the bottom of each panel, so I could basically swing the bottom into perfect alignment and then “Velcro” it to the wall in the right position. Command Strips are pretty strong, and technically I might have been able to use them to secure the panels to the walls completely with no other mounting hardware. But these panels are right around the weight limits for Command Strips, and I’ve never used Command Strips before. I wasn’t sure how much I could trust them to hold the full weight of the panels, especially since my walls are textured (not completely flat), and the backs of the panels are wood (also having some texture and not 100% flat). I really didn’t want to risk panels potentially falling off the walls if the adhesive doesn’t hold.

The Command Strip solution worked perfectly for straightening out the crooked panels, so I’m happy with that fix. With a few 412 panels, I got lucky in that the panels were very straight with the default mounting, so I only used the Command Strips to straighten out 5 of the 8 panels of that type.

With the larger 422 panels, the brackets are far enough offset from each other (16″ apart as I installed them), so that made it much easier to get those hanging straight (with 0.25″ or less horizontal difference from top to bottom). I didn’t need to use any Command Strips to straighten those panels.

Teamwork

This was a great project to do with Rachelle because our strengths complemented each other nicely. I’m good at driving projects forward with action and decisiveness, but sometimes to keep advancing, I will gloss over aesthetic concerns and favor functional solutions. Rachelle is way more detail-oriented, and she has proper color vision whereas I’m color blind. She’s much better at picking color schemes and considering aesthetics. She largely picked the colors and fabrics whereas I focused on the acoustical considerations.

We spent hours going over the color and fabric options for the panels before we ordered them, taping fabric swatches to the walls to try to visualize what the results would look like. The panels are made to order, and it costs a lot to ship them, so we wanted to do our best to get the choices right the first time. Before we placed the order, we mapped out where we’d placed every single panel in each room.

I did reject some color options that didn’t look good to me. For instance, the spa and gray colors look identical to me. Those are the 3rd and 5th panels in the first pic above, respectively. I didn’t want those colors next to each other because it seemed like two of the same in a row. It was a bit tricky to identify options that looked good to both of us color-wise, but we managed.

I also wanted to get a variety of colors, so we could potentially change them up by swapping panels from different locations. That also gives us more flexibility in case one color doesn’t look so good on camera. So we have some backup possibilities, just in case we need them.

Fortunately I think we succeeded. I don’t have any regrets about the panel choices thus far. It will take time to give them a thorough test, but so far they do seem to work well acoustically.

This is my first experience with acoustic panels. As with many upgrades of this nature, you quickly learn that you could have gone further than you did because more is always possible.

For this project I wanted to go far enough to create a nice improvement that I’ll appreciate, but not so far as to feel like I’m over-reaching, over-spending, taking too long, or getting bogged down in micro-decisions. I decided going into this project that I should also stick with the basics, at least until I have a better grasp of how these panels work acoustically. I decided to avoid the really artistic design possibilities for now, even though I’m aware that way more is possible in that direction. Likewise I felt it was a wise decision to begin with simple sound blankets until I felt the timing was right to upgrade to acoustic panels.

I like that this project felt edgy and took me a bit out of my comfort zone, especially in terms of dealing with colors. I also like how it mixed audio and visual decisions with hand-ons working with tools. It took some patience to drive it to completion, so it was a good project to approach with a very methodical attitude. I found it helpful to acknowledge and celebrate each little act of progress along the way, including picking the colors, placing the order, unboxing everything, and installing each individual panel in its proper position. It feels good to have it all done. 😁

Share Button

Researchers demonstrate new sensors by creating novel health monitoring, machine interface devices

Researchers at North Carolina State University have developed a stretchable strain sensor that has an unprecedented combination of sensitivity and range, allowing it to detect even minor changes in strain with greater range of motion than previous technologies. The researchers demonstrated the sensor’s utility by creating new health monitoring and human-machine interface devices.

Strain is a measurement of how much a material deforms from its original length. For example, if you stretched a rubber band to twice its original length, its strain would be 100%.

“And measuring strain is useful in many applications, such as devices that measure blood pressure and technologies that track physical movement,” says Yong Zhu, corresponding author of a paper on the work and the Andrew A. Adams Distinguished Professor of Mechanical and Aerospace Engineering at NC State.

“But to date there’s been a trade-off. Strain sensors that are sensitive — capable of detecting small deformations — cannot be stretched very far. On the other hand, sensors that can be stretched to greater lengths are typically not very sensitive. The new sensor we’ve developed is both sensitive and capable of withstanding significant deformation,” says Zhu. “An additional feature is that the sensor is highly robust even when over-strained, meaning it is unlikely to break when the applied strain accidently exceeds the sensing range.”

The new sensor consists of a silver nanowire network embedded in an elastic polymer. The polymer features a pattern of parallel cuts of a uniform depth, alternating from either side of the material: one cut from the left, followed by one from the right, followed by one from the left, and so on.

“This feature — the patterned cuts — is what enables a greater range of deformation without sacrificing sensitivity,” says Shuang Wu, who is first author of the paper and a recent Ph.D. graduate at NC State.

The sensor measures strain by measuring changes in electrical resistance. As the material stretches, resistance increases. The cuts in the surface of the sensor are perpendicular to the direction that it is stretched. This does two things. First, the cuts allow the sensor to deform significantly. Because the cuts in the surface pull open, creating a zigzag pattern, the material can withstand substantial deformation without reaching the breaking point. Second, when the cuts pull open, this forces the electrical signal to travel further, traveling up and down the zigzag.

“To demonstrate the sensitivity of the new sensors, we used them to create new wearable blood pressure devices,” Zhu says. “And to demonstrate how far the sensors can be deformed, we created a wearable device for monitoring motion in a person’s back, which has utility for physical therapy.”

“We have also demonstrated a human-machine interface,” Wu says. “Specifically, we used the sensor to create a three-dimensional touch controller that can be used to control a video game.”

“The sensor can be easily incorporated into existing wearable materials such as fabrics and athletic tapes, convenient for practical applications,” Zhu says. “And all of this is just scratching the surface. We think there will be a range of additional applications as we continue working with this technology.”

The work was done with support from the National Science Foundation, under grant number 2122841; the National Institutes of Health, under grant number R01HD108473; and the U.S. Department of Defense, under grant number W81XWH-21-1-0185.

Story Source:

Materials provided by North Carolina State University. Original written by Matt Shipman. Note: Content may be edited for style and length.

Share Button

Self-powered, printable smart sensors created from emerging semiconductors could mean cheaper, greener Internet of Things

Creating smart sensors to embed in our everyday objects and environments for the Internet of Things (IoT) would vastly improve daily life — but requires trillions of such small devices. Simon Fraser University professor Vincenzo Pecunia believes that emerging alternative semiconductors that are printable, low-cost and eco-friendly could lead the way to a cheaper and more sustainable IoT.

Leading a multinational team of top experts in various areas of printable electronics, Pecunia has identified key priorities and promising avenues for printable electronics to enable self-powered, eco-friendly smart sensors. His forward-looking insights are outlined in his paper published on Dec. 28 in Nature Electronics.

“Equipping everyday objects and environments with intelligence via smart sensors would allow us to make more informed decisions as we go about in our daily lives,” says Pecunia. “Conventional semiconductor technologies require complex, energy-intensity, and expensive processing, but printable semiconductors can deliver electronics with a much lower carbon footprint and cost, since they can be processed by printing or coating, which require much lower energy and materials consumption.”

Pecunia says making printable electronics that can work using energy harvested from the environment — from ambient light or ubiquitous radiofrequency signals, for example — could be the answer.

“Our analysis reveals that a key priority is to realize printable electronics with as small a material set as possible to streamline their fabrication process, thus ensuring the straightforward scale-up and low cost of the technology,” says Pecunia. The article outlines a vision of printed electronics that could also be powered by ubiquitous mobile signals through innovative low-power approaches — essentially allowing smart sensors to charge out of thin air.

“Based on recent breakthroughs, we anticipate that printable semiconductors could play a key role in realizing the full sustainability potential of the Internet of Things by delivering self-powered sensors for smart homes, smart buildings and smart cities, as well as for manufacturing and industry.”

Pecunia has already achieved numerous breakthroughs towards self-powered printable smart sensors, demonstrating printed electronics with record-low power dissipation and the first-ever printable devices powered by ambient light via tiny printable solar cells.

His research group at SFU’s School of Sustainable Energy Engineering focuses on the development of innovative approaches to eco-friendly, printable solar cells and electronics for use in next-generation smart devices.

Pecunia notes that the semiconductor technologies being developed by his group could potentially allow the seamless integration of electronics, sensors, and energy harvesters at the touch of a ‘print’ button at single production sites — thereby reducing the carbon footprint, supply chain issues and energetic costs associated with long-distance transport in conventional electronics manufacturing.

“Due to their unique manufacturability, printable semiconductors also represent a unique opportunity for Canada,” he says. “Not only to become a global player in next-generation, eco-friendly electronics, but also to overcome its reliance on electronics from faraway countries and the associated supply chain and geo-political issues.

“Our hope is that these semiconductors will deliver eco-friendly technologies for a future of clean energy generation and sustainable living, which are key to achieving Canada’s net-zero goal.”

Story Source:

Materials provided by Simon Fraser University. Original written by Marianne Meadahl. Note: Content may be edited for style and length.

Share Button

Researchers find hints of a ‘hidden state’ involving one of Earth’s most abundant ions

While conducting an otherwise straightforward investigation into the assembly mechanism of calcium-phosphate clusters, researchers at UC Santa Barbara and New York University (NYU) made a surprising discovery: Phosphate ions in water have a curious habit of spontaneously alternating between their commonly encountered hydrated state and a mysterious, previously unreported ‘dark’ state. This recently uncovered behavior, they say, has implications for understanding the role of phosphate species in biocatalysis, cellular energy balance and the formation of biomaterials. Their findings are published in the Proceedings of the National Academy of Sciences.

“Phosphate is everywhere,” said UCSB chemistry professor Songi Han, one of the authors of a paper in the Proceedings of the National Academy of Sciences. The ion consists of one phosphorus atom surrounded by four oxygen atoms. “It’s in our blood and in our serum,” Han continued. “It’s in every biologist’s buffer, it’s on our DNA and RNA.” It’s also a structural component of our bones and cell membranes, she added.

When bound with calcium, phosphates form small, molecular clusters on their way toward forming mineral deposits in cells and bone. That’s what Han and collaborators Matthew Helgeson at UCSB and Alexej Jerschow at NYU were preparing to study and characterize, in hopes of uncovering quantum behaviors in symmetric phosphate clusters proposed by UCSB physics professor Matthew Fisher. But first, the researchers had to set up control experiments, which involved scans of phosphate ions in the absence of calcium via nuclear magnetic resonance (NMR) spectroscopy and cryogenic transmission electron microscopy (cryo-TEM).

But as the UCSB and NYU students on the project were collecting reference data, which involved the naturally occurring isotope phosphorus 31 in aqueous solutions at varying concentrations and temperatures, their results didn’t match up with expectations. For instance, Han said, the line that represents the spectrum for 31P during NMR scans is supposed to narrow with increasing temperatures.

“The reason is, as you go to higher temperatures, the molecules tumble faster,” she explained. Typically, this rapid molecular motion would average out the anisotropic interactions, or interactions that are dependent on the relative orientations of these small molecules. The result would be a narrowing of resonances measured by the NMR instrument.

“We were expecting a phosphorus NMR signal, which is a simple one, with a peak that narrows with higher temperatures,” she said. “Surprisingly, though, we measured spectra that were broadening, doing the complete opposite of what we expected.”

This counterintuitive result set the team on a new path, following experiment after experiment to determine its molecular-level cause. The conclusion, after a year of eliminating one hypothesis after another? Phosphate ions were forming clusters under a wide range of biological conditions — clusters that were evading direct spectroscopic detection, which is likely why they had not been observed before. Furthermore, the measurements suggested these ions were alternating between a visible “free” state and a dark “assembled” state, hence the broadening of the signal instead of a sharp peak.

Additionally, as the temperature increased, the number of these assembled states was also increasing, another temperature-dependent behavior, according to co-lead author Mesopotamia Nowotarski.

“The conclusion from those experiments was that the phosphates are dehydrating and that allows them to come closer together,” she said. At lower temperatures, the vast majority of these phosphates in solution cling to water molecules that form a protective water coat around them. This hydrated state is typically assumed when considering how phosphate behaves in biological systems. But at higher temperatures, Nowotarski explained, they shed their water shields, allowing them to stick to each other. This concept was confirmed by NMR experiments that probed the phosphate water shell, and further validated by analysis of cryo-TEM images to identify the existence of clusters, as well as modeling the energetics of phosphate assembly by co-lead author Joshua Straub.

These dynamic phosphate assemblies and hydration shells have important implications for biology and biochemistry, according to the researchers. Phosphate, said chemical engineer Matthew Helgeson, is a commonly understood “currency” used in biological systems to store and consume energy through conversion into adenosine triphosphate (ATP) and adenosine diphosphate (ADP). “If hydrated phosphate, ADP and ATP represent small ‘bills’ of currency, this new discovery suggests that these smaller currencies can exchange with much larger denominations — say $100 — which may have very different interactions with biochemical processes than currently known mechanisms,” he said.

Also, many biomolecular components include phosphate groups that may, similarly, form clusters. Hence, the finding that these phosphates can spontaneously assemble might shed some light on other fundamental biological processes such as biomineralization — how shells and skeletons form, as well as protein interactions.

“We also tested a range of phosphates, including those incorporated into the ATP molecule, and they all appear to show the same phenomenon, and we achieved quantitative analysis for these assemblies,” said co-lead author Jiaqi Lu.

This once overlooked process could also be significant in the realms of cell signaling, metabolism and disease processes such as Alzheimer’s disease, where the attachment of a phosphate group, or phosphorylation, to the protein tau in our brain is commonly found in neurofibrillary tangles — a hallmark of neurodegeneration. Having seen and studied this assembly behavior, the team is now digging deeper, with studies on the effect of pH on phosphate assembly, genetic translation and modified protein assembly, as well as their original work on calcium phosphate assembly.

“It really changes the way we think about the role of phosphate groups that we typically don’t consider a driver of molecular assembly,” Han said.

Research in this paper was also conducted by Tanvi Sheth and Sally Jiao at UC Santa Barbara.

Share Button

Damar Hamlin: Why do some young athletes suffer cardiac arrest?

American football star Damar Hamlin is the latest athlete to encounter heart problems.

Share Button