Some women are opting for fertility tracking apps to avoid mood swings and weight gain on “hormonal” contraception.


Some women are opting for fertility tracking apps to avoid mood swings and weight gain on “hormonal” contraception.
I’ll say it: The power TikTok has on my nighttime routine is unmatched. After I’ve popped a melatonin, brushed my teeth and settled under the covers, I’m heading to the app for funny videos and relatable content.
Whether or not TikTok is here to stay is up in the air, although it’s increasingly looking like a ban might take effect in the coming days. But until then, I think it’s safe to say I’m one of many users who enjoys the platform. From recipes and beauty trends to mood-boosting hacks and products that are actually useful, dare I say that TikTok is low-key a lifestyle hub?
Advertisement
As with anything, though, too much of a good thing is… well, not a good thing. At what point can endless scrolling be unhelpful, or even harmful? At what point can TikTok use point toward addiction, affect work and relationships, and even cause a sour mood?
Ahead, therapists and counsellors who specialise in addiction share a major sign you’re addicted to TikTok, why TikTok is so addicting and what to do if your usage causes problems.
Addiction experts agree that one sign stands out: Your use of the app takes over your life.
“The biggest red flag is when TikTok starts to interfere with daily responsibilities or relationships,” said Michael Villarreal, the CEO of Tres Vistas Recovery, an addiction treatment centre in California. “If someone finds themselves skipping work tasks, ignoring family or friends, or struggling to keep up with school or chores because they’re too wrapped up in endless scrolling, that’s a strong sign that their usage has become very unhealthy.”
Advertisement
That comes down to one thing. “As with any addiction, the main indicator of a problem is lack of control,” said Beth Chippendale Katona, a licensed clinical professional counsellor and a licensed clinical addiction counsellor with Thriveworks in Kansas City, Missouri. “The individual experiences consequences and is not able to curb the behaviour.”
It’s important to note that people experiencing addiction may feel like they’re in control, but that’s not necessarily the case.
If all of that sounds a little too familiar, you’re far from the only one. Villarreal shared an example from his practice. “I once worked with a client who realised her sleep patterns were entirely off because she’d get caught up in the ‘just one more video’ loop until 3 a.m.,” he recalled.
Advertisement
Addiction and unhealthy usage can present themselves in other noteworthy ways, too. Providers urge people to look out for the following signs.
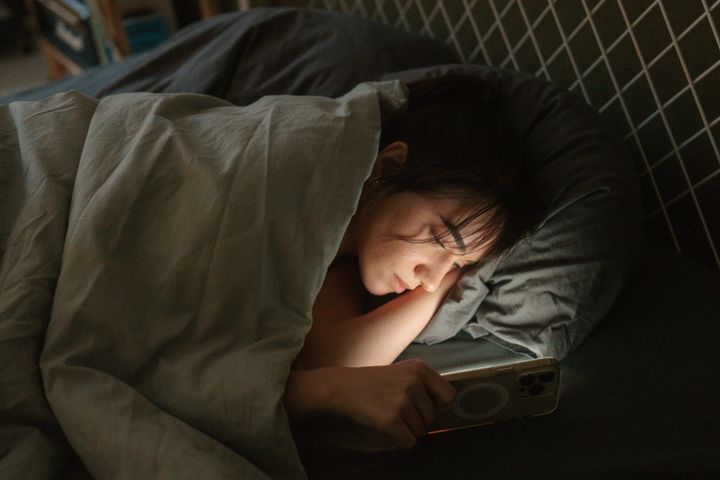
Whether you’re taking a break at work, going to the bathroom or fighting the need to get out of bed, an urge to watch TikTok may arise — and that’s not necessarily a great thing.
“If TikTok is the first thing you think about in the morning and the last thing before bed, or if you’re constantly replaying videos in your head during other activities, that’s a sign your brain is hyper-focused on it,” Villarreal said.
Advertisement
Feeling anxious, bored or irritable without TikTok, or relying on it for validation, are other signs of dependency, according to Villarreal.
Claire Wilson, a therapist with Kelley Counselling & Wellness, also pointed this out. “There can be abrupt shifts in mood when access to TikTok is restricted,” she said. “One may notice a tendency to frequently incorporate TikTok into discussions with others, leading to comparisons with individuals featured on the platform, which can adversely impact one’s mood and mental well-being.”
Yep, spending too much time on TikTok can even cause physical problems, unfortunately.
“Spending hours glued to your phone can lead to physical issues like eye strain, headaches or neck pain — what some jokingly call ’tech neck,’” Villarreal said.
Advertisement
AleksandarNakic via Getty Images
Loving TikTok isn’t necessarily an addiction, so at what point is it?
According to Wilson, it’s when “dependency may distort one’s understanding of reality, resulting in a loss of personal identity, alterations in personality, decreased self-esteem and even suicidal thoughts.”
Katona summarised her take with three key words: level of impact. When your work, school, relationships and goals suffer greatly because of TikTok, she said, you may be looking at an addiction.
Advertisement
“In essence, an unhealthy relationship is problematic but can usually be addressed with intentional changes, while addiction is more compulsive and often requires outside help or intervention,” she explained.
So why is it so dang easy to get lost in the sauce of TikTok? How are silly videos so engaging that they can cause real damage?
“TikTok is brilliantly designed to keep you hooked,” Villarreal said. “It’s like a slot machine: You don’t know what’s coming next, but you’re sure it’ll be entertaining, so you keep scrolling.”
Advertisement
Besides the way it provides endless entertainment and excitement, TikTok’s formulation is also strategic. Katona spoke to the algorithm tailoring content for you, the stress relief it provides and how it can help you feel connected to others in a more comfortable, easy way.
Wilson added that the dopamine high is “similar to a high one can get from a drug” and can even “lead to withdrawal symptoms and the onset of addiction, escalating to more serious forms of dependency.”
“Comprehending the functionality of TikTok and its impact on users is essential,” Wilson said. “Acknowledging a potential addiction to TikTok is a crucial first step.”
Advertisement
The same holds true for other social media apps. Consider the following expert-backed tips:
Since the “just one more video” mindset can be a slippery slope (been there, done that), try to set specific, firm boundaries around how much time you want to spend on the app. For example, maybe an hour spread out over the day, or only when you’re in line at the store.
Certain tools can make this easier. Villarreal mentioned TikTok’s built-in screen time settings, which Apple phones typically have, too.
Villarreal suggested dedicating certain spaces — like your bedroom or the dinner table — as tech-free areas. “This helps you reconnect with life outside the screen,” he said.
Advertisement
What else do you like to do in your downtime? That may be an easier, more enjoyable way to replace screen time.
Examples of activities Villarreal mentioned include reading, walking and other hobbies. Maybe it’s time to finally meet that reading goal or even bring back the hot girl walk.
Feel a compulsion to get on the app? Ask yourself why.
“Are you bored, stressed or avoiding something?” Villarreal asked. “Address the root feeling instead of escaping into the app.”
Advertisement
For example, maybe you’re trying to avoid an uncomfortable feeling that’s better addressed, at least long-term, in therapy. Or maybe you’re bored and realise pursuing another weeknight activity would fulfil you more.
You’re not alone in this journey. Besides having settings and goals to help keep you accountable, you can also talk to someone.
“If you’re struggling to cut back, talk to someone, maybe a trusted friend, therapist or support group,” Villarreal said. “There’s no shame in reaching out for help.”
Advertisement
Looking for a therapist who specialises in addiction or practices cognitive behavioral therapy may be especially fruitful. CBT is a type of therapy that looks at a person’s thoughts and how they affect mood and behaviour.
“This method aids in restructuring cognitive patterns and unlearning detrimental habits, while also equipping individuals with coping strategies and alternatives,” Wilson explained.
Group therapy may also be advantageous, she added. For example, users may benefit from a Media Addicts Anonymous group, which is similar to the more commonly known Alcoholics Anonymous.
Advertisement
TL;DR? “It’s normal to enjoy social media, but the distinction lies in impact,” Villarreal said. “Unhealthy use becomes a full-blown addiction when it starts significantly disrupting someone’s mental, emotional or physical health.”
At that point or earlier, these suggestions may be needed for truly happier living.


While wildfires are ravaging L.A and right-wing internet personalities are making terrifying waves, it may feel like optimism is the most impossible emotion to find in these times.
However, optimism and hope are forces for good, and it turns out, can actually benefit both your physical and mental health, too.
Advertisement
Speaking to Futurity, lawyer Scott L Rogers says: “Optimism shapes how individuals interpret situations, often reducing their perceived stressfulness.
“Moreover, when faced with a stressful situation, optimism can help navigate it more effectively, leading to better outcomes that enhance emotional well-being.”
He adds: “Research suggests that approaching life’s events with a more optimistic outlook can enhance physical health, partly due to the release of hormones and neurotransmitters that improve mood and provide protective effects on the body.
Advertisement
“Additionally, positive emotions associated with optimism may boost the immune system, making the body more resistant to infections, reducing the risk of chronic diseases, and offering protection against anxiety and depression.”
Dr Ricardo Twumasi, lecturer in organisational psychiatry and psychology at King’s College London spoke with The i Paper about optimism and said: “I would generally define optimism as, in a situation where a positive and negative outcome are both likely, to expect the favourable outcome. There’s still a groundedness and rationality to it. You can be optimistic but pragmatic.”
So, optimism is less blind faith and more believing that the good thing that’s posisble to happen, will happen. If it’s just as likely as the bad possibility, where’s the harm in looking on the bright side?
Advertisement
He recommends setting small, practical goals for yourself and acknowledging when you’ve achieved them.
He said: “Changing to the point that you think about life in a more positive way is a big change, but it happens behaviourally on a really small level, and all those small behaviours build up into the way we interact with the world.”
Make tiny changes it is.


Norovirus is one of those nasty winter bugs that just does not relent.
It can survive even the most potent of hand gels, as well as freezing temperatures, and it takes as few as 10 viral particles to make you sick.
So it’s no wonder really that so many people in the UK get struck down, and even end up hospitalised, with the illness each year.
Advertisement
The bug, which is characterised mainly by violent bouts of vomiting and diarrhoea, typically goes away in 48 hours.
But those two days can seem like a lifetime when you’re firmly glued to the loo.
If you’re sat there smugly thinking you haven’t been bitten by the noro-bug this year, there might be a reason why.
According to Professor Patricia Foster, an expert in biology at Indiana University Bloomington, your blood type as well as whether you make a certain antigen in your body, could influence your vulnerability to the winter illness.
Advertisement
She explained that people with the B blood type tend to be more resistant to the bug, while those with A, AB and O blood types are more likely to become ill.
And here’s where things get a little complicated.
Prof Foster previously explained that a person’s blood type – whether A, B, AB or O – is “dictated by genes that determine which kinds of molecules, called oligosaccharides, are found on the surface of your red blood cells”.
These oligosaccharides are made up of sugars that are linked together. They attach to red blood cells – a bit like little koala bears – and can also be found in the cells that line your small intestine.
Advertisement
Now norovirus and some other viruses love these oligosaccharides because they can easily attach to them and then infect you via the intestine (cue: lovely gastro symptoms).
And a lot of norovirus strains need one oligosaccharide in particular, known as the H1-antigen, to hop on board.
Now some people – about 20% of the European-derived population, Prof Foster suggested – don’t make the H1-antigen in their intestinal cells. And, as a result, they are less likely to get sick from norovirus.
Advertisement
And for a similar reason, those with the B blood type tend to be more resistant because, as the BBC reported, fewer strains of norovirus have evolved to attach to their oligosaccharides.
Whew. The more you know…

My due date was fast approaching when I had a moment of clarity. Or it might have been madness, I’ll let you decide.
I’d been receiving maternity care at a local hospital – the same hospital where my eldest daughter had been born almost three years earlier – and decided I really didn’t want to go back there to give birth.
Advertisement
So, at 34 weeks pregnant, I went online and did what I knew best: researched.
With my laptop perched on my ballooning belly, I looked at other hospitals and saw there were some decent options. But, palms all sweaty, I quickly realised it was the thought of another trip to the labour ward that was filling me with so much dread.
I briefly considered a home birth but realised I wouldn’t be able to relax properly if I knew our neighbours could hear me mooing away (and believe me they would be able to hear it – our walls are paper thin).
Then I saw something intriguing on Instagram of all places: a freestanding NHS birth centre and it was just 10 minutes further than the hospital where I’d been receiving antenatal care. How had I never heard about it?
Advertisement
I’m not a particularly anxious person but the very thought of going back to that first hospital to give birth filled me with dread. Just thinking about it would make my heart race.
The thing is, I had always thought I didn’t have a particularly bad experience at that hospital – compared to the horror stories I’ve heard, it was a “walk in the park”. I was one of the lucky ones. My birth was relatively straightforward: it was a vaginal delivery, no interventions, and my baby was OK.
I experienced some tearing but didn’t really think much of it at the time because it was all quite numb down there. My partner got kicked out a couple of hours after giving birth, which I found to be the most distressing part of all because I had no idea how to look after a baby and was absolutely exhausted.
Advertisement
I remember spending the following 12 hours sat in a bloody hospital gown waiting for my partner to be allowed back into the hospital for visiting hours (cheers, Covid) so I could finally have a shower and hand our newborn over to him.
I was exhausted because I’d barely slept all night – my daughter had been born late the night before, so I’d been up all night checking she was still breathing and listening to the coughs of other mums on the shared ward, hoping they didn’t have Covid. It also happened to be the hottest day of the year which only added to my anxiety.
In the days and weeks after the birth, I experienced some issues with an infection and my stitches coming undone. I also saw a GP at my eight-week follow up appointment who checked my perineal area and suggested my tear had been worse than first thought.
Advertisement
“I was one of the lucky ones. My birth was relatively straightforward: it was a vaginal delivery, no interventions, and my baby was OK.””
Compared to a lot of other women who experience traumatic births – it’s estimated 30,000 women are impacted each year – my experience was, I believed at the time, OK.
Only now am I realising that actually… it wasn’t.
I felt I couldn’t really complain about the fact the midwife “popped my vein” – she failed to put a cannula into my arm before I was about to give birth, so we had to wait for a doctor to come and do it. My blood platelets had been on the low side so they thought they’d put a cannula in ahead of time in case I needed a blood transfusion or something – a thought which made me feel really relaxed!
Advertisement
Or the fact that I had to be on a labour ward because of those cursed platelets and all I could hear in the rooms along the corridor were screams.
Or the fact I had two midwives – an experienced staff member and a student – rummaging around in my vagina, one after the other, before delivery. It prompted a panic attack and, I’d argue, was more painful than birth at points. Now, I know midwives are short on time and we all have to learn, but I was not prepared for how painful that examination was going to be. And I wasn’t allowed an epidural because of the platelet issue, so I felt it all.
These things were all unpleasant, but nothing compared to what I’ve heard from other mums. I was a lucky one, right? My baby survived.
Advertisement
Some aren’t so lucky.
I’ve heard horror stories of babies being left with brain damage as a result of mistakes made during birth. I’ve spoken to women who have experienced physical injuries that have left them with bladder and bowel incontinence for years – potentially, for the rest of their lives. Black women in the UK are almost three times more likely to die during pregnancy or up to six weeks after birth.
I realise now – after years of mentally dismissing what had happened – that perhaps there was a reason why my body was going into fight or flight when I sat down to consider the thought of another hospital birth.
My body was saying no, and thank goodness I listened.
Advertisement
So, at 34 weeks pregnant, I switched up my maternity care. It’s fairly easy to do – I self-referred to the birth centre and then called the hospital and explained I was moving my care across.
I had to do another booking appointment (this is the first appointment you usually do when receiving antenatal care in England, where they check your weight, height, take urine and blood samples, etc.,), but on the whole it was an easy process.
And I cannot stress to you how refreshing it was to speak to the midwives at Edgware Birth Centre.
They were so relaxed and didn’t overly-medicalise things. I asked about my platelets again and they didn’t seem worried – my midwife was so reassuring and, unlike at the hospital where I’d seen a different person each time, this person was someone I spoke to continuously for the following six weeks.
It’s hard to express what a game-changer it was having the same midwife for my antenatal appointments. When we chatted on multiple occasions in the run up to the birth, I felt like I was a human, not just a number who was there to pop out a baby.
Advertisement
On the day I gave birth, I went to the birth centre at around 11am when my contractions were ramping up and called my midwife en route, who amazingly was on shift. They got a room ready for me and started filling the birth pool, as I’d asked if I could try that for pain relief purposes and also to help reduce the risk of tearing again.
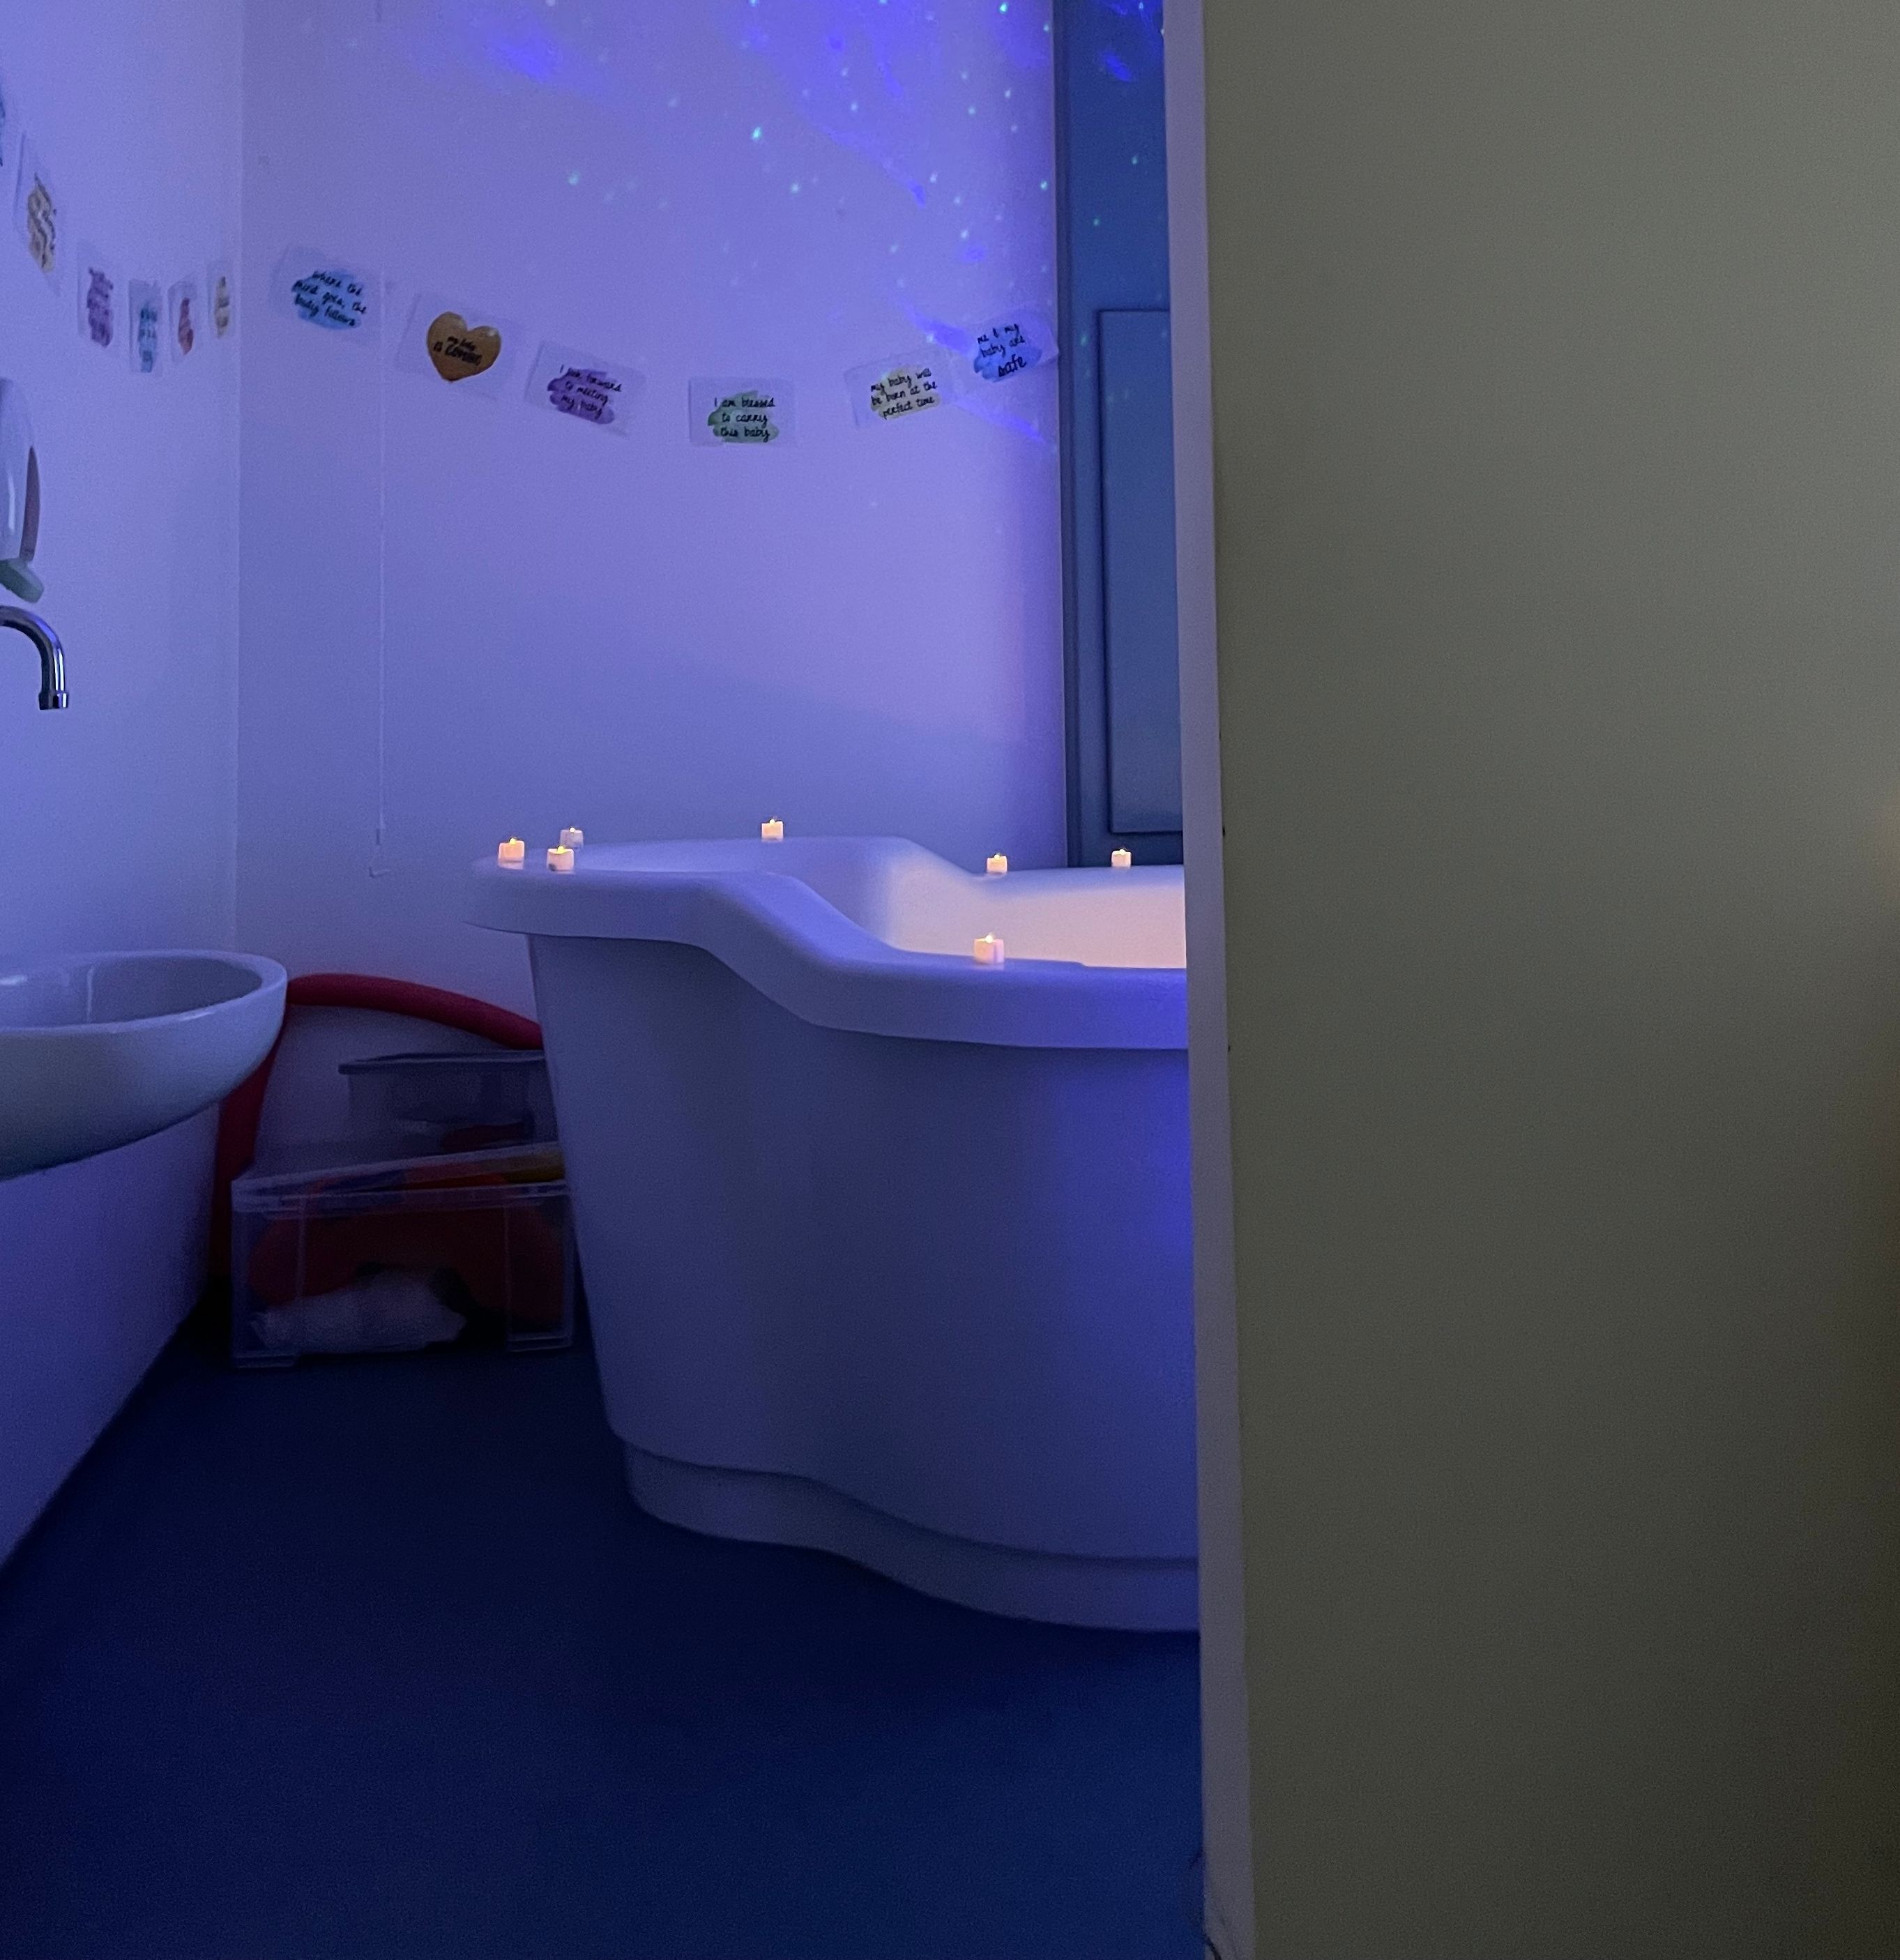
When we got there, we went straight to the room and I nearly cried. They’d turned some fairy lights on and there was a diffuser pumping out a calming fragrance in the corner. The birth pool was trickling away. There was nobody screaming in the distance. The atmosphere was so… tranquil.
“Do you want a drink?” my midwife calmly asked me, and then my partner. We looked at each other in disbelief.
Advertisement

Natasha Hinde
The next few hours were a bit of a blur but consisted of a lot of reassurance from my midwife and her colleague who kept telling me that I knew what I was doing, to listen to my body, and to let them know if I felt an urge to push.
I believe their kindness and reassurance, as well as the feeling of safety from being in this little sanctuary they’d created on my behalf, helped everything speed up a bit and by 2.30pm, our baby was in my arms.
Advertisement
I didn’t need stitches (thank you, birth pool) and by 7pm we were home.
It was a good birth – and I feel bad for saying that, because so many women do not get to have a good birth. I firmly believe that if I hadn’t switched up my care at the eleventh hour, it might not have been a good birth.
And of course, we can never know, but studies have found having a baby at a birth centre is as safe as giving birth in hospital, yet results in fewer interventions.
However, the story doesn’t end there. A few months after I gave birth, I received an email inviting me to join a consultation about the proposed closure of the birth centre. The NHS North Central London Integrated Care System said that, on average, fewer than 50 women give birth there a year.
Advertisement
Under proposed new plans, the birth suites could be closed however the birth centre would still provide antenatal and postnatal services. I couldn’t believe what I was reading.
Deflated by the proposed closure, I attended the online consultation and sat listening to other mothers who had received positive experiences there.
The stories I heard hammered home exactly what can happen if a maternity service isn’t overwhelmed with demand and midwives can truly focus on the people giving birth: they are treated like human beings. The midwives have more to give because they are not physically, mentally and emotionally exhausted.
Advertisement
The decision on the fate of the birth centre is due to be announced this spring.
Dr Jo Sauvage, chief medical officer at North Central London Integrated Care System, told me: “Your positive feedback is a great reflection of the midwifery team at Edgware Birth Centre. We want, above all else, for everyone who gives birth in North Central London to have a similarly high quality of experience, and this means making some difficult decisions.
“The proposed option that we put forward for consultation would see us retain and expand the antenatal and postnatal services at Edgware Birth Centre. For those who choose a midwifery-led birth, we are proposing to maintain the option of home birth, and co-located midwifery-led units which provide a home from home environment.”
It’s abundantly clear we need to keep banging the drum for improved maternity care in the UK and that means calling on the government to do more: to urgently prioritise and begin to fix the midwife staffing crisis and to funnel more money into maternity healthcare.
Advertisement
I appreciate money doesn’t grow on trees, but when the Care Quality Commission (CQC) warns that cases of women receiving poor care and being harmed in childbirth are in danger of becoming “normalised”, and 65% of units are not safe for women to give birth in, you know something is fundamentally wrong.
Action group Delivering Better is currently calling on the Secretary of State for Health and Social Care, Wes Streeting – who has openly said the maternity crisis keeps him awake at night – to improve maternity care with two key changes: the chance to see the same midwife throughout pregnancy and proactive health checks after the baby is born at three and six months. You can add your voice to the open letter here.
There’s a lot of work to be done when it comes to overhauling the UK’s maternity and postnatal care system – and one birth centre cannot change that. But if it helps women have a good birth, a safe birth, then I’d argue it’s worth its weight in gold.
Advertisement
Update: We have amended the article to clarify that, on average, fewer than 50 women give birth at Edgware Birth Centre each year.


In the years following the launch of NASA’s Hubble Space Telescope, astronomers have tallied over 1 trillion galaxies in the universe. But only one galaxy stands out as the most important nearby stellar island to our Milky Way — the magnificent Andromeda galaxy (Messier 31). It can be seen with the naked eye on a very clear autumn night as a faint cigar-shaped object roughly the apparent angular diameter of our Moon.
A century ago, Edwin Hubble first established that this so-called “spiral nebula” was actually very far outside our own Milky Way galaxy — at a distance of approximately 2.5 million light-years or roughly 25 Milky Way diameters. Prior to that, astronomers had long thought that the Milky way encompassed the entire universe. Overnight, Hubble’s discovery turned cosmology upside down by unveiling an infinitely grander universe.
Now, a century later, the space telescope named for Hubble has accomplished the most comprehensive survey of this enticing empire of stars. The Hubble telescope is yielding new clues to the evolutionary history of Andromeda, and it looks markedly different from the Milky Way’s history.
Without Andromeda as a proxy for spiral galaxies in the universe at large, astronomers would know much less about the structure and evolution of our own Milky Way. That’s because we are embedded inside the Milky Way. This is like trying to understand the layout of New York City by standing in the middle of Central Park.
“With Hubble we can get into enormous detail about what’s happening on a holistic scale across the entire disk of the galaxy. You can’t do that with any other large galaxy,” said principal investigator Ben Williams of the University of Washington. Hubble’s sharp imaging capabilities can resolve more than 200 million stars in the Andromeda galaxy, detecting only stars brighter than our Sun. They look like grains of sand across the beach. But that’s just the tip of the iceberg. Andromeda’s total population is estimated to be 1 trillion stars, with many less massive stars falling below Hubble’s sensitivity limit.
Photographing Andromeda was a herculean task because the galaxy is a much bigger target on the sky than the galaxies Hubble routinely observes, which are often billions of light-years away. The full mosaic was carried out under two Hubble programs. In total, it required over 1,000 Hubble orbits, spanning more than a decade.
This panorama started with the Panchromatic Hubble Andromeda Treasury (PHAT) program about a decade ago. Images were obtained at near-ultraviolet, visible, and near-infrared wavelengths using the Advanced Camera for Surveys and the Wide Field Camera 3 aboard Hubble to photograph the northern half of Andromeda.
This program was followed up by the Panchromatic Hubble Andromeda Southern Treasury (PHAST), recently published in The Astrophysical Journal and led by Zhuo Chen at the University of Washington, which added images of approximately 100 million stars in the southern half of Andromeda. This region is structurally unique and more sensitive to the galaxy’s merger history than the northern disk mapped by the PHAT survey.
The combined programs collectively cover the entire disk of Andromeda, which is seen almost edge-on — tilted by 77 degrees relative to Earth’s view. The galaxy is so large that the mosaic is assembled from approximately 600 separate fields of view. The mosaic image is made up of at least 2.5 billion pixels.
The complementary Hubble survey programs provide information about the age, heavy-element abundance, and stellar masses inside Andromeda. This will allow astronomers to distinguish between competing scenarios where Andromeda merged with one or more galaxies. Hubble’s detailed measurements constrain models of Andromeda’s merger history and disk evolution.
A Galactic ‘Train Wreck’
Though the Milky Way and Andromeda formed presumably around the same time many billions of years ago, observational evidence shows that they have very different evolutionary histories, despite growing up in the same cosmological neighborhood. Andromeda seems to be more highly populated with younger stars and unusual features like coherent streams of stars, say researchers. This implies it has a more active recent star-formation and interaction history than the Milky Way.
“Andromeda’s a train wreck. It looks like it has been through some kind of event that caused it to form a lot of stars and then just shut down,” said Daniel Weisz at the University of California, Berkeley. “This was probably due to a collision with another galaxy in the neighborhood.”
A possible culprit is the compact satellite galaxy Messier 32, which resembles the stripped-down core of a once-spiral galaxy that may have interacted with Andromeda in the past. Computer simulations suggest that when a close encounter with another galaxy uses up all the available interstellar gas, star formation subsides.
“Andromeda looks like a transitional type of galaxy that’s between a star-forming spiral and a sort of elliptical galaxy dominated by aging red stars,” said Weisz. “We can tell it’s got this big central bulge of older stars and a star-forming disk that’s not as active as you might expect given the galaxy’s mass.”
“This detailed look at the resolved stars will help us to piece together the galaxy’s past merger and interaction history,” added Williams.
Hubble’s new findings will support future observations by NASA’s James Webb Space Telescope and the upcoming Nancy Grace Roman Space Telescope. Essentially a wide-angle version of Hubble (with the same sized mirror), Roman will capture the equivalent of at least 100 high-resolution Hubble images in a single exposure. These observations will complement and extend Hubble’s huge dataset.

As the atmosphere continues to fill with greenhouse gases from human activities, many proposals have surfaced to “geoengineer” climate-saving solutions, that is, alter the atmosphere at a global scale to either reduce the concentrations of carbon or mute its warming effect.
One recent proposal seeks to infuse the atmosphere with hydrogen peroxide, insisting that it would both oxidize methane (CH4), an extremely potent greenhouse gas while improving air quality.
Too good to be true?
University of Utah atmospheric scientists Alfred Mayhew and Jessica Haskins were skeptical, so they set out to test the claims behind this proposal. Their results, published on Jan. 3, confirm their doubts and offer a reality check to agencies considering such proposals as a way to stave off climate change.
“Our work showed that the efficiency of the proposed technology was quite low, meaning widespread adoption of the technology would be required to make any meaningful impact on atmospheric CH4,” said Mayhew, a postdoctoral researcher with the university’s Wilkes Center for Climate Science & Policy. “Then, our results indicate that if this technology is adopted at scale, then we start to see some negative air-quality side effects, particularly for wintertime particulate matter air pollution.”
To conduct the study, the Utah scientists modeled what would happen if you deployed the technology patented by a Canadian company, which is proposing to spray aerosolized hydrogen peroxide, or H₂O₂, into the atmosphere during daylight hours from 600-meter towers. These towers would approach the height of the world’s tallest radio towers.
“When that hydrogen peroxide is in the presence of sunlight, it’s going to make a really powerful oxidant, the hydroxyl radical OH,” said Haskins, an assistant professor of atmospheric sciences. “That’s a natural scrubber in the atmosphere, and it’s going to help speed up the conversion of methane to CO₂.”
Methane is a single-bonded molecule combination of carbon and hydrogen, as opposed to the double-bonded compounds that are far more common in the atmosphere. Hydroxyls are more likely to oxidize those double-bonded molecules, such as the isoprene coming off trees or volatile organic compounds, so OH is just not that efficient for breaking down methane, according to Haskins.
“OH doesn’t react fast with methane,” Haskins said. “It’s reacting with so many other things.”
Methane’s outsized impact on the climate
While carbon dioxide from fossil fuels gets much of the blame for climate change, methane is also a big contributor. Eventually, methane breaks down into carbon dioxide and water.
The primary ingredient in the natural gas burned in home appliances and power plants, methane, or CH4, packs 76 times more climate-warming punch than carbon dioxide over a 20-year timeframe. Methane persists in the atmosphere for only 12 years, but the gas is blamed for nearly a third of the rise in global temperatures since the Industrial Revolution, according to the International Energy Agency.
Anthropogenic sources, primarily oil, gas and coal operations and landfills, account for 60% of global methane emissions.
Artificially speeding up methane oxidation could slow climate change, but such geoengineering projects could carry adverse environmental impacts, which Haskins’s lab seeks to characterize. A recent report from the National Academy of Sciences concluded the unintended consequences of atmospheric methane removal technologies are likely significant but poorly understood. Haskins’ study is heeding the report’s call to scrutinize these technologies, such as the one that would release vast amounts of hydrogen peroxide.
“We could buy ourselves about 50 years and avoid some of the immediate impacts of climate change if we did this, but no one had actually previously done any side-effects studies to see what was going to happen,” Haskins said. “This is very first paper to assess any air quality side effects of such geoengineering solutions.”
Geoengineering’s potential side effects
Manipulating a system as complex as Earth’s atmosphere is an inherently dangerous action, potentially resulting in unforeseen problems.
“There’s so many feedbacks that can go on in the climate. Atmospheric chemistry is just one example. You change one thing and you think it’s going to do this, but it actually may do the opposite in one place versus the other,” Haskins said. “You have to be really careful and do these sorts of assessments. Is this a responsible thing to do? What’s the impact going to be?”
By way of example, Haskins raised the troubling history of humanmade gasses called chlorofluorocarbons, or CFCs, which ate into the protective layer of ozone that shields Earth from harmful ultraviolet radiation.
“We started using CFCs in industry as propellants and refrigerants, and suddenly we cause the ozone hole,” she said. “And we’ve been dealing with the consequences of that for 40 years. And we still won’t have a fully resolved no-ozone-hole year until probably 2060, so we have to be careful of what we’re doing.”
Mayhew and Haskins used a global chemical-transport model, called GEOS-Chem, to simulate the proposal to release hydrogen peroxide from towers. The goal was to estimate how much methane would be oxidized under three different emission scenarios, from light to extreme.
Their simulation envisioned the use of 50 towers spread around North America. Replicating the company’s proposal, the medium-release scenario called for each tower to spray 612 grams, or 1.35 pounds, per second for 10 hours a day for a year.
“This proposed solution just won’t remove any meaningful amount of methane from the atmosphere. It’s not going to solve global warming. At most, we found 50 towers could reduce 0.01% of annual anthropogenic methane emissions,” Haskins said. “You’d need about 352,000 of them to remove 50% of anthropogenic methane. It’s an insane number. And if you did 50 high-emission towers, you’d still need about 43,000.”
In the meantime, places with poor wintertime air quality could see particulate pollution get much worse.
“There’s potential that future research could show that the air quality impacts of placing these towers close to methane point sources is minimal if they’re activated at certain times of the year, and far from large population centers,” Mayhew said. “If that’s the case, then this technology (or similar approaches) could play a very small role in combating warming, but it’s clear from our work that the air-quality side effects should be placed as a central consideration for any proposed real-world implementation of technology like this.”

Cultural traits — the information, beliefs, behaviors, customs, and practices that shape the character of a population — are influenced by conformity, the tendency to align with others, or anti-conformity, the choice to deliberately diverge. A new way to model this dynamic interplay could ultimately help explain societal phenomena like political polarization, cultural trends, and the spread of misinformation.
A study published in the Proceedings of the National Academy of Sciences outlines this novel approach. Presenting a mathematical model, SFI Complexity Postdoctoral Fellow Kaleda Denton with colleagues at Stanford University — former SFI Post-baccalaureate Fellow Elisa Heinrich Mora, SFI External Professor Marcus Feldman, and Michael Palmer — expand on previous research to offer a more realistic representation of how conformist and anti-conformist biases shape the transmission of cultural traits through a population.
“The idea behind this research was to come up with a better way to mathematically represent how individuals make decisions in the real world,” says Denton. “If we can do that, we can then scale things up to see what would happen in a population of 10,000 people over the long run.”
Traditional models of conformity often assume individuals gravitate toward the average or “mean” trait in a population. This concept works well if the most popular traits are near this mean, which may be the case for, say, working hours or food portion sizes. However, the mean is a poor indicator of popularity in other cases; for example, if most people fall on either the far left or far right of a political spectrum, but the mean lies in the center.
To address this gap, the authors designed a model that incorporates trait clustering. In this model, individuals conform by adopting traits that are more clustered together (e.g., variations of a far-left political belief) rather than the mean trait in the population (e.g., the centrist view). Anti-conformists, on the other hand, deliberately distance themselves from the traits of their peers, creating polarization.
Using computer simulations, the team analyzed how traits spread across populations over multiple generations. Conformity often led to groups clustering around specific traits, but not necessarily the average. Anti-conformity created a starkly different pattern: a U-shaped distribution, with individuals clustering at the extremes and leaving the middle sparsely populated.
One significant finding was that populations rarely converge to a single trait unless the unrealistic assumption of perfect behavioral copying is imposed. Instead, even small variations in how individuals interpret or adopt traits result in persistent diversity.
“These outcomes align with what we observe in the real world, where cultural practices and ideologies don’t simply average out but instead maintain significant variation,” Denton says.
The research also challenges the notion that conformity always leads to homogeneity. The model shows that under certain conditions, conformity can sustain diversity, while anti-conformity amplifies polarization.
Denton sees broad implications for the study. “This framework could help explain voting behavior, social media trends, or even how people estimate values in group settings,” she says. “It offers a way to understand how individual decisions aggregate into societal patterns, whether that’s consensus-building or polarization.” This model can be tested on real-world data in future studies.
“We’re excited to see if this framework works in different scenarios,” Denton said. “The ultimate goal is to understand how individual choices influence entire populations over time.

The Universe really seems to be expanding fast. Too fast, even.
A new measurement confirms what previous — and highly debated — results had shown: The Universe is expanding faster than predicted by theoretical models, and faster than can be explained by our current understanding of physics.
This discrepancy between model and data became known as the Hubble tension. Now, results published in the Astrophysical Journal Letters provide even stronger support to the faster rate of expansion.
“The tension now turns into a crisis,” said Dan Scolnic, who led the research team.
Determining the expansion rate of the Universe — known as the Hubble constant — has been a major scientific pursuit ever since 1929, when Edwin Hubble first discovered that the Universe was expanding.
Scolnic, an associate professor of physics at Duke University, explains it as trying to build the Universe’s growth chart: we know what size it had at the Big Bang, but how did it get to the size it is now? In his analogy, the Universe’s baby picture represents the distant Universe, the primordial seeds of galaxies. The Universe’s current headshot represents the local Universe, which contains the Milky Way and its neighbors. The standard model of cosmology is the growth curve connecting the two. The problem is: things don’t connect.
“This is saying, to some respect, that our model of cosmology might be broken,” said Scolnic.
Measuring the Universe requires a cosmic ladder, which is a succession of methods used to measure the distances to celestial objects, with each method, or “rung,” relying on the previous for calibration.
The ladder used by Scolnic was created by a separate team using data from the Dark Energy Spectroscopic Instrument (DESI), which is observing more than 100,000 galaxies every night from its vantage point at the Kitt Peak National Observatory.
Scolnic recognized that this ladder could be anchored closer to Earth with a more precise distance to the Coma Cluster, one of the galaxy clusters nearest to us.
“The DESI collaboration did the really hard part, their ladder was missing the first rung,” said Scolnic. “I knew how to get it, and I knew that that would give us one of the most precise measurements of the Hubble constant we could get, so when their paper came out, I dropped absolutely everything and worked on this non-stop.”
To get a precise distance to the Coma cluster, Scolnic and his collaborators, with funding from the Templeton foundation, used the light curves from 12 Type Ia supernovae within the cluster. Just like candles lighting a dark path, Type Ia supernovae have a predictable luminosity that correlates to their distance, making them reliable objects for distance calculations.
The team arrived at a distance of about 320 million light-years, nearly in the center of the range of distances reported across 40 years of previous studies — a reassuring sign of its accuracy.
“This measurement isn’t biased by how we think the Hubble tension story will end,” said Scolnic. “This cluster is in our backyard, it has been measured long before anyone knew how important it was going to be.”
Using this high-precision measurement as a first rung, the team calibrated the rest of the cosmic distance ladder. They arrived at a value for the Hubble constant of 76.5 kilometers per second per megaparsec, which essentially means that the local Universe is expanding 76.5 kilometers per second faster every 3.26 million light-years.
This value matches existing measurements of the expansion rate of the local Universe. However, like all of those measurements, it conflicts with measurements of the Hubble constant using predictions from the distant Universe. In other words: it matches the Universe’s expansion rate as other teams have recently measured it, but not as our current understanding of physics predicts it. The longstanding question is: is the flaw in the measurements or in the models?
Scolnic’s team’s new results adds tremendous support to the emerging picture that the root of the Hubble tension lies in the models.
“Over the last decade or so, there’s been a lot of re-analysis from the community to see if my team’s original results were correct,” said Scolnic, whose research has consistently challenged the Hubble constant predicted using the standard model of physics. “Ultimately, even though we’re swapping out so many of the pieces, we all still get a very similar number. So, for me, this is as good of a confirmation as it’s ever gotten.”
“We’re at a point where we’re pressing really hard against the models we’ve been using for two and a half decades, and we’re seeing that things aren’t matching up,” said Scolnic. “This may be reshaping how we think about the Universe, and it’s exciting! There are still surprises left in cosmology, and who knows what discoveries will come next?”
This work was conducted with funding from the Templeton Foundation, the Department of Energy, the David and Lucile Packard Foundation, the Sloan Foundation, the National Science Foundation and NASA.

Across most of the Northeast, getting bitten by a blacklegged tick — also called a deer tick — is a risk during spring, summer, and fall. A new Dartmouth study, published in Parasites and Vectors, finds that 50% of adult blacklegged ticks carry the bacteria that causes Lyme disease while 20% to 25% of the younger (nymph) blacklegged ticks carry the bacteria.
A team of researchers from universities, health departments, and agricultural agencies from across the Northeast conducted a meta-analysis of data on how many blacklegged ticks there are and how many of them have the potential to pass pathogens responsible for Lyme disease and three other tick-borne diseases in the Northeast from 1989 to 2021, including in Connecticut, New York, New Hampshire, Vermont, and Maine.
Data was collected in Maine starting in 1989, while most of the other states began data collection in the mid- 2000s. Massachusetts and Rhode Island were not represented in the study due to either unavailable or insufficient data.
Lyme disease was first discovered in Lyme, Conn, in 1975. Its symptoms can vary depending on the stage and severity of the disease but can include a rash, fever, chills, fatigue, muscle or joint aches, and swollen lymph nodes. If left untreated, prolonged and more severe symptoms may develop.
Lyme disease is caused by a bacteria calledBorrelia burgdorferi. Some but not all, white-footed mice, chipmunks, birds, squirrels, and other small animals carry the bacteria in their blood, making them “competent” hosts. Blacklegged ticks are not born infected with the Lyme disease bacteria. But when a blacklegged tick feeds on an infected host, the tick can get the bacteria that causes Lyme disease and then potentially spread it to humans through its bite. Other animals, like white-tailed deer, are “incompetent hosts,” so while they are a food source for blacklegged ticks, they do not transmit the Lyme disease bacteria.
Blacklegged ticks typically consume three blood meals over the course of a two-year life cycle: after they hatch into larvae in the midsummer of their first year; as nymphs during the following late spring, often in May or June; and as adults that fall, most likely between September and November.
In general, ticks must be attached to a person for at least 24 hours to transmit the Lyme disease bacteria. So even though adult blacklegged ticks are more likely to carry the bacteria than younger ticks, because they are bigger, about the size of a sesame seed, there is particular concern about the younger ticks or nymphs, which are only about the size of a poppy seed, making them difficult to spot.
“While the bacteria responsible for Lyme disease has a complicated chain of transmission, our results show the relative abundance of blacklegged ticks, and just how many of them are carrying disease-causing pathogens throughout the Northeast,” says lead author Lucas Price, who was a postdoctoral fellow in geography at Dartmouth at the time of the study and is now a wildlife biologist at the Interior Department’s Bureau of Land Management.
The researchers analyzed the abundance of blacklegged ticks and the presence of Lyme disease bacteria and other pathogens so that they could determine how blacklegged ticks and the pathogens they carry are changing in time and space.
“Contrary to the well-documented spread of blacklegged ticks and Lyme disease over the past 30 years, we found very small changes in the abundance of blacklegged ticks, but think this is likely because we usually don’t start sampling a location for blacklegged ticks until they’re already established,” says senior author Jonathan Winter, an associate professor of geography and director of the Applied Hydroclimatology Group at Dartmouth. However, we did find an increase in the percentage of blacklegged ticks that carry the Lyme disease bacteria.”
These findings underscore advice from the Centers for Disease Control and Prevention and health professionals, who recommend a range of tick bite prevention measures, including conducting full-body tick checks after spending time outdoors in regions where pathogen-carrying ticks are present. While much of the data were already available publicly prior to the study, the team made the surveys consistent across states, creating one of the most comprehensive tick abundance and pathogen prevalence datasets in the United States, and establishing a baseline that can be used in the future.
The researchers have another study underway examining the relationship between climate change and the prevalence of blacklegged ticks and Lyme disease in the Northeast.
Joseph Savage, a graduate student in the Ecology, Evolution, Environment & Society program at Dartmouth, also contributed to the study.
